XRP [XRP/USD] Technical Analysis: Cryptocurrency struggles to rise as other coins enjoy the bull party
![XRP [XRP/USD] Technical Analysis: Cryptocurrency struggles to rise as other coins enjoy the bull party](https://coinhub.news/img/6b/6b5c2ef6e60bac7b349637b37dd8655b_730_522.webp)
The cryptocurrency market seems to have taken a roller coaster ride with some coins seeing an uptrend while others are still under the bear’s thumb. Bitcoin [BTC], Ethereum [ETH] and Bitcoin Cash [BCH] are all riding the bull wave while XRP still seems to be having trouble getting out of the bear’s shadow.
1-hour:

The trend lines show a clear downtrend with the prices dropping from $0.466 to $0.457.
The MACD line and the signal line have both crossed over to start an uptrend moving in tandem.
The Chaikin Money Flow indicator has crashed below the axis which is a clear sign of the bearish market taking control. The crash also signifies that the money is flowing out of the market on the back of the change in investor sentiments.
1-day:
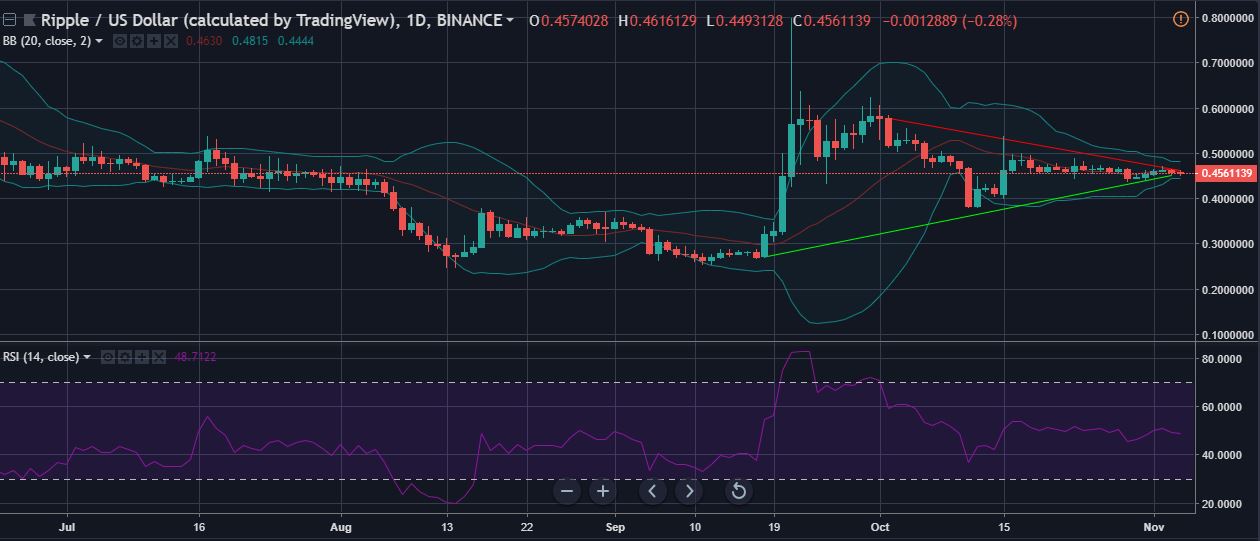
The XRP one day graph shows a downtrend where the prices have fallen from $0.57 to $0.46.
The Bollinger bands have taken the shape of a strict pipe after the constriction of the Bollinger cloud. The pipe-formation is a sign of the sideways price movement.
The Relative Strength Index graph has been holding steady between the oversold zone and the overbought zone. The middle hold points to an equilibrium between the buying pressure and the selling pressure.
Conclusion:
The above-mentioned indicators all point to a slight bearish market, with only the MACD taking the side of the bull. XRP looks to continue on the set path of a sideways price movement with sporadic bull rises.


Article comments