XRP Technical Analysis: Bears to dominate the market on a long run

XRP, the second largest cryptocurrency by market capitalization has seen a significant downfall since the month of November and it continues the struggle to gain its momentum back. At the time of writing, XRP is trading at $0.28 with a market cap of $11.75 billion. The coin has shown a decline rate of approximately 7% in the past 1 week.
1-hour:
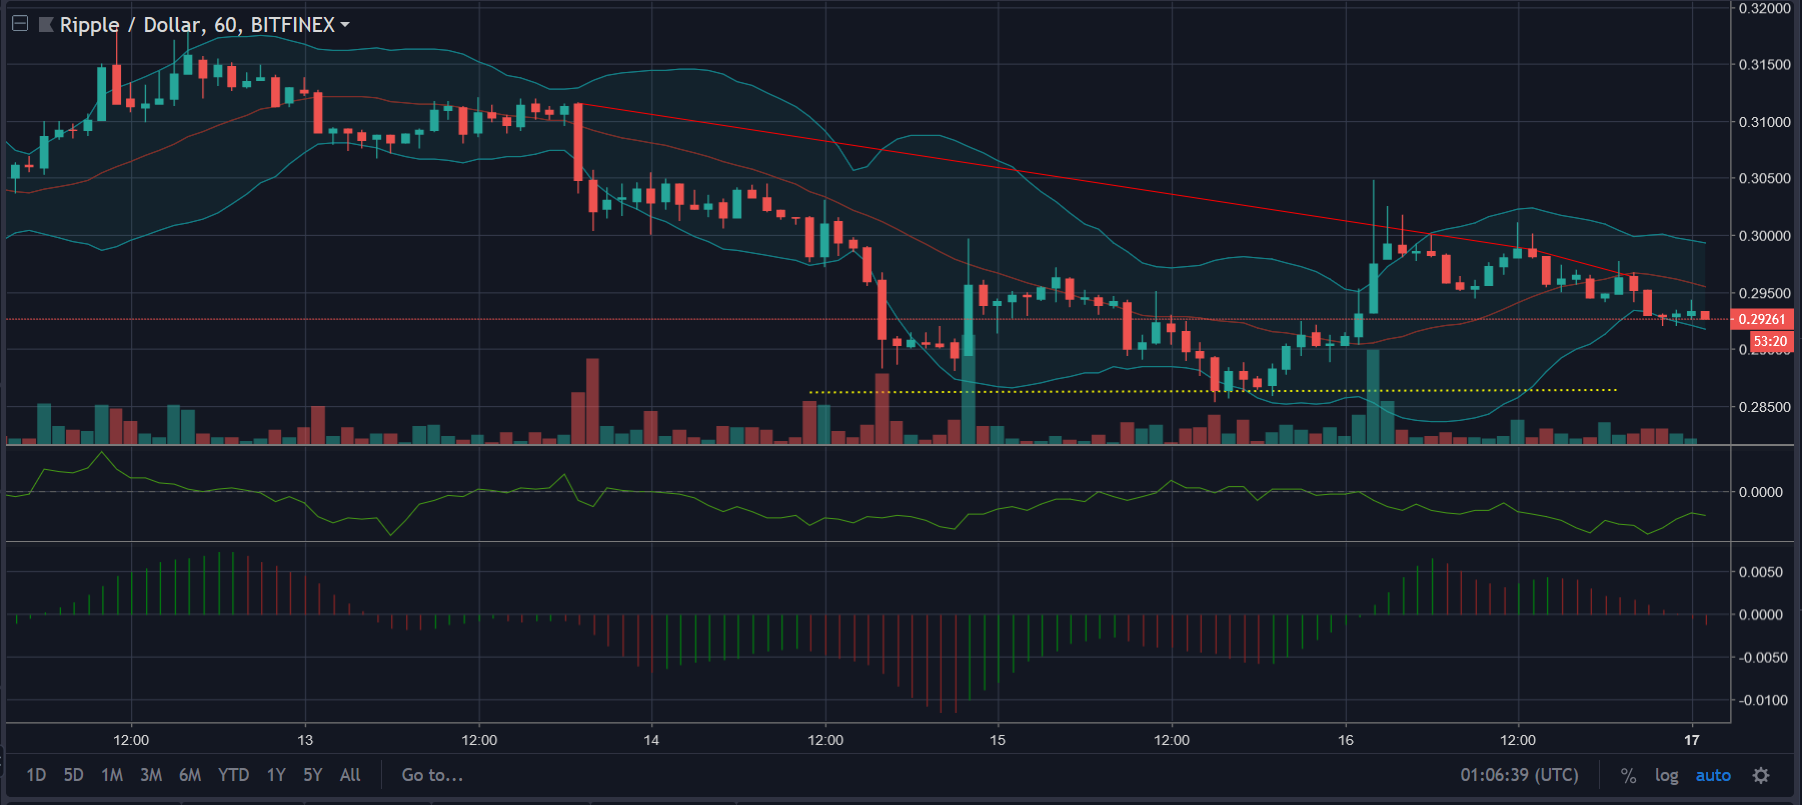
The 1 hour chart of XRP is currently depicting a downtrend extending from $0.31 – $0.29 with a support point set at $0.28.
Bollinger Band is currently showing a bearish trend as the candlesticks are forming below the Simple Moving Average [SMA]. The bands are diverging by leaving a huge gap for volatility in the XRP market.
The Chaikin Money Flow [CMF] has dropped down below the zero line, indicating a slow moving money inflow in the market at the moment.
The Awesome Oscillator is also on the bearish end as the indicator shows an increasing red bars forming below the zero line.
24-hours:
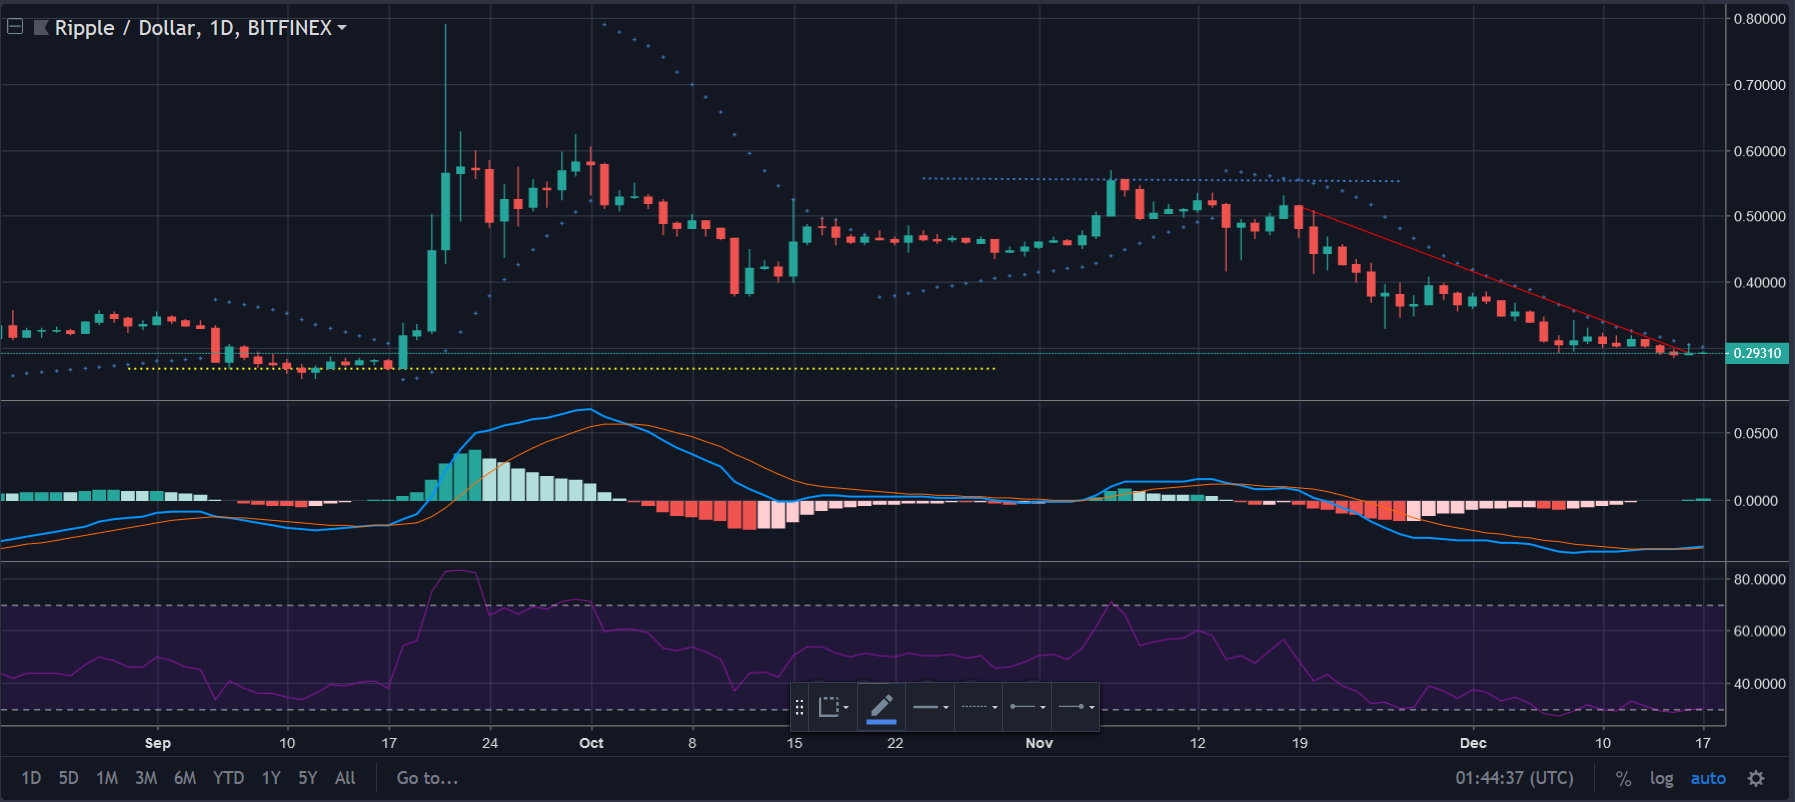
The daily chart of XRP is clearly on the bearish side with a downtrend extending from $0.51 – $0.29. The support and resistance points are set at $0.27 and $0.55 respectively.
The Parabolic SAR has formed an extended dotted indicator above the candlesticks, pushing them completely downwards to further test the existing support points.
The MACD is currently moving along the lowest mark with both the moving average and signal lines showing a downtrend in this timeline.
The Relative Strength Index [RSI] has touched the oversold mark and continues to move in the same direction without any progress.
Conclusion:
In this Technical Analysis, we notice that in both the timeframes all the indicators depicts a bearish presence in case of XRP. The Parabolic SAR and MACD in the one day statistics indicate that the bears are clearly dominating the market on a long run.


Article comments