Tron [TRX/USD] Technical Analysis: Cryptocurrency shows signs of returning to bull’s kingdom
![Tron [TRX/USD] Technical Analysis: Cryptocurrency shows signs of returning to bull’s kingdom](https://coinhub.news/img/64/64f11957b8086a24697730139492c66d_730_522.webp)
Tron [TRX], the tenth-biggest cryptocurrency, has shown better performance in the bear’s market in comparison to other cryptocurrencies in the market. Moreover, the cryptocurrency made a wave by surpassing Monero [XMR] and Cardano [ADA] in terms of market capitalization.
According to CoinMarketCap, at press time, Tron was trading at $0.0133, with a market cap of $882.02 million. The cryptocurrency shows a trading volume of $61.47 million and has plunged by 8.08% in the past seven days.
1-hour
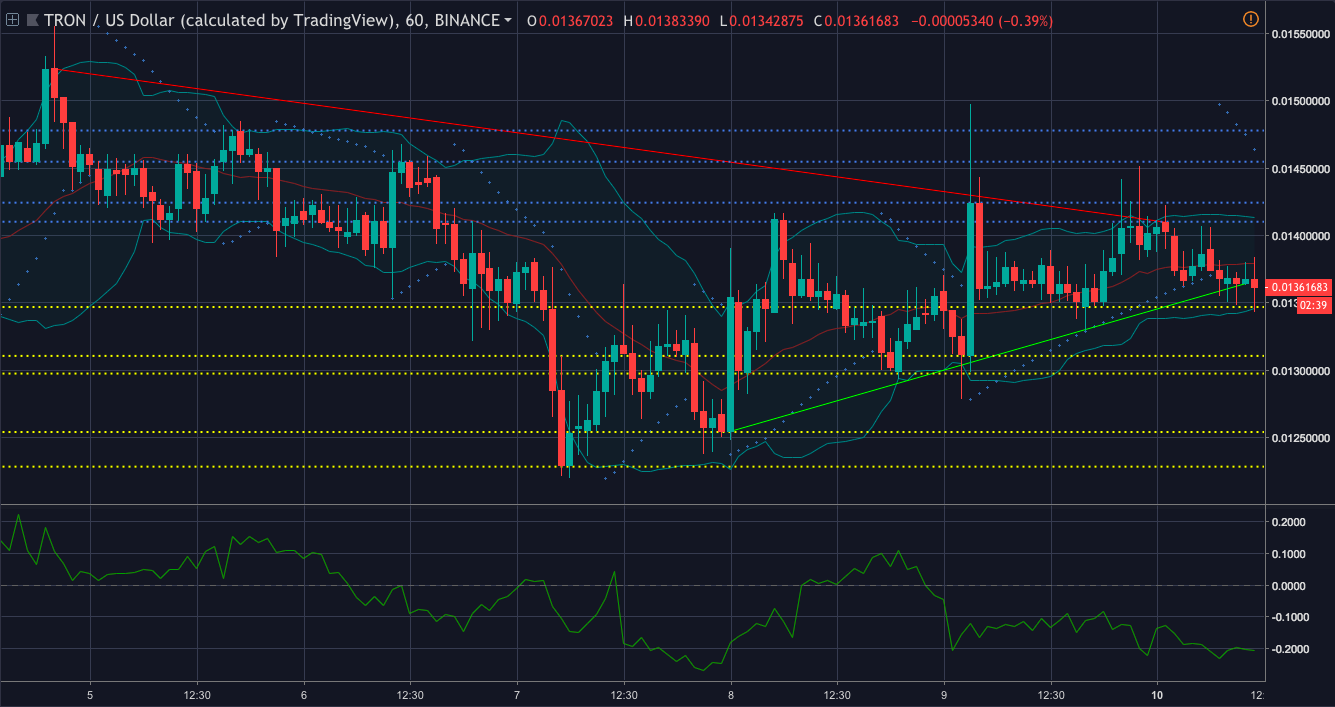
In the one-hour price chart, the coin records a downtrend from $0.0152 to $0.0140. It also shows a slight uptrend from $0.0125 to $0.0136. The coin has an immediate resistance level set at $0.0141 and a strong resistance level set at $0.0147. The chart depicts that the cryptocurrency has an immediate support at $0.0134 and strong support at $0.0122.
Parabolic SAR shows that the coin has stepped into the bear’s sphere as the dots have started to align on top of the candlesticks.
Chaikin Money Flow also pictures the same scenario as the money has started to flow outside the market.
Bollinger Bands is forecasting a less volatile market for the coin as the bands have started to reunite.
1-day
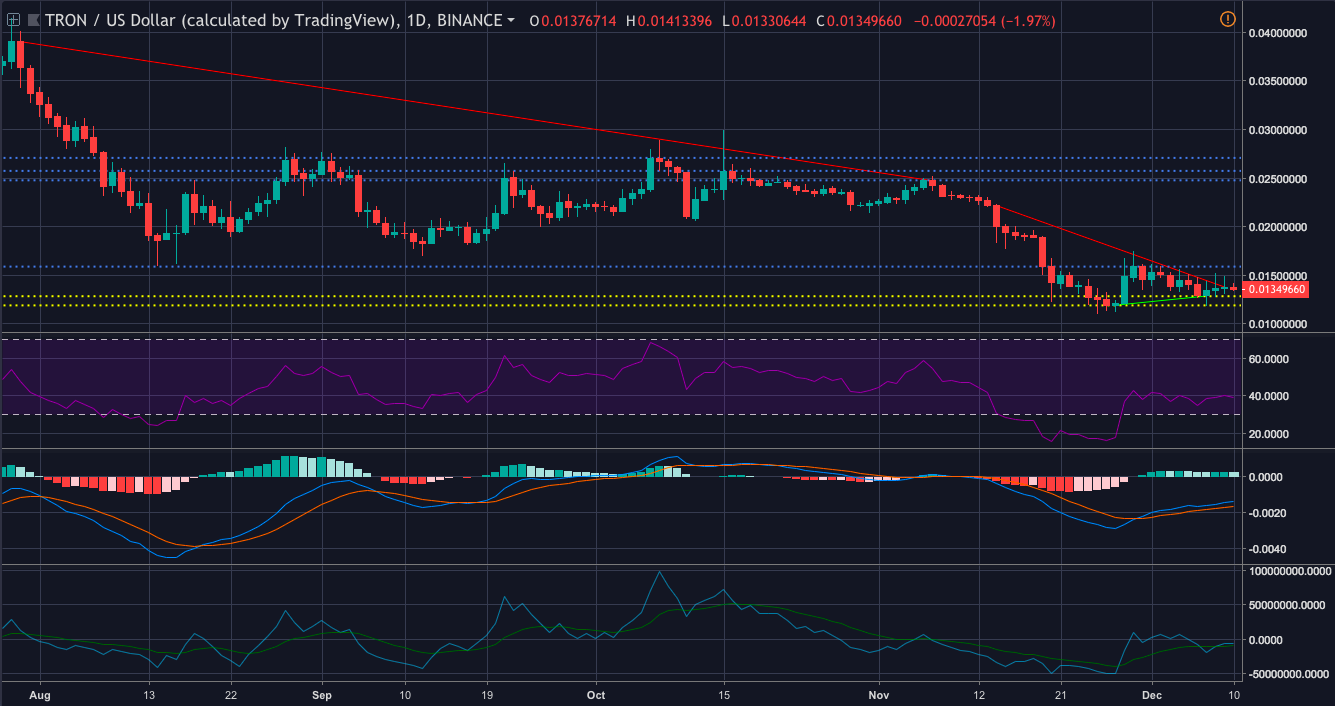
In the one-day price chart, the coin demonstrates a downtrend from $0.0390 to $0.0247. It records another downfall from $0.0221 to $0.0137. It has an uptrend from $0.0119 to $0.0128. The immediate resistance for the cryptocurrency is at $0.0158 and the strong resistance is at $0.0270. The chart also shows that the immediate support for the coin is at $0.0128 and the strong support is at $0.0118.
MACD is forecasting that the coin will find its path back to the bull’s sphere as the moving average line has made a crossover, only to take the move north.
Klinger Oscillator is nodding yes to MACD’s forecast as the reading line has made a bullish crossover.
RSI is showing that the buying pressure and the selling pressure for the coin is currently evened out in the market.
Conclusion
The Parabolic SAR and CMF from the one-chart show that the coin has strayed off to the bear’s side of the market. However, MACD and Klinger Oscillator from the one-day chart are predicting that the coin will find its way back to the bull’s side.


Article comments