Tron [TRX] Technical Analysis: Token crawls on support line as bear blocks all exits
![Tron [TRX] Technical Analysis: Token crawls on support line as bear blocks all exits](https://coinhub.news/img/a2/a23630bfad44e0f8859ed9f9ca4803a8_730_522.webp)
Tron [TRX] the tenth-largest coin in the cryptocurrency market, has been fighting the bear for a long time and the bout does not seem to be over yet. With the market changing almost every day, TRX has to try harder to maintain its position in the top-10 list.
According to CoinMarketCap, the coin was valued at $0.0127, with a market cap of $848 million. TRX registered a 24-hour trade volume of $53 million, with a recorded slip of 2.65% within 24 hours, at the time of press. The coin registered an overall plunge by 4.84% over a week.
1-hour
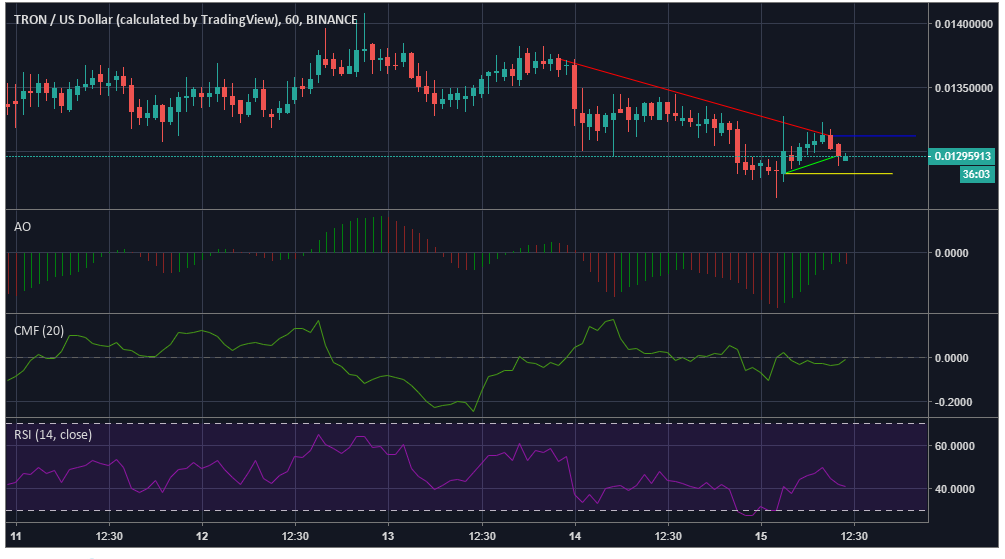
According to the one-hour chart, the coin noted a downtrend from $0.0137 to $0.0131. The coin registered a brief uptrend from $0.0128 to $0.0129, at the time of press. The coin registered an immediate resistance of $0.0131 and a strong support at $0.0128.
Awesome Oscillator indicates a bearish market gaining momentum.
Chaikin Money Flow is in line with Awesome Oscillator in pointing towards a bearish market. However, it might take a bullish stance soon.
Relative Strength Index shows that the buying and selling pressures are evening each other out, but the RSI line appears to be closer to the bearish end.
1-day
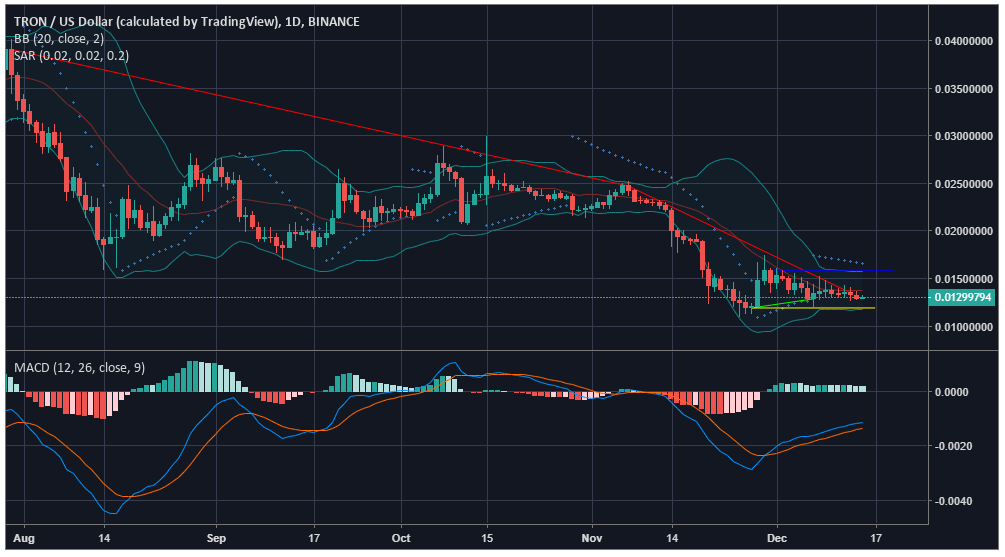
As per the one-day chart, the coin reported a massive downtrend from $0.0390 to $0.0247, which continued further to $0.0130. The coin marked a minimal uptrend from $0.0119 to $0.0128. It registered an immediate resistance at $0.0158, while a strong support was offered at $0.0119.
Bollinger Bands appear to be converging but as per the previous trend might diverge, increasing the price volatility in the market. The moving average line is seen to be above the candles marking a bearish market.
Parabolic SAR also indicates a bearish market with markers above the candles.
MACD line is above the signal line, pointing a bullish market, unlike other indicators. however, there might be a crossover coming soon.
As per the indicators Bollinger Bands and Chaikin Money Flow, the coin appears to be siding with the bear. However, considering the volatility in the market, changing trends is nothing new the crypto world.


Article comments