Tron [TRX] Technical Analysis: Token befriends bull in the bearish market
![Tron [TRX] Technical Analysis: Token befriends bull in the bearish market](https://coinhub.news/img/73/73ffe7ee0cbb7b04871ac210560b4378_730_522.webp)
The cryptocurrency market, after seeing tremendous growth, has been seen bleeding. However, the only coin surging in the bear market is Tron [TRX], which observed the growth of 6.34% in the past day.
At the time of press, TRX was valued at $0.0255, with a market cap of $1.7 billion. The 24-hour trade volume of the coin was noted to be $236 million, with a growth of 10.54%. TRX has observed an overall growth of 32% over the past week. The coin was traded highly on Bit-Z exchange with TRX/BTC pair with a volume of $42 million, followed by Binance. Binance reported a trading volume of $20 million with the TRX/USDT pair.
1-hour
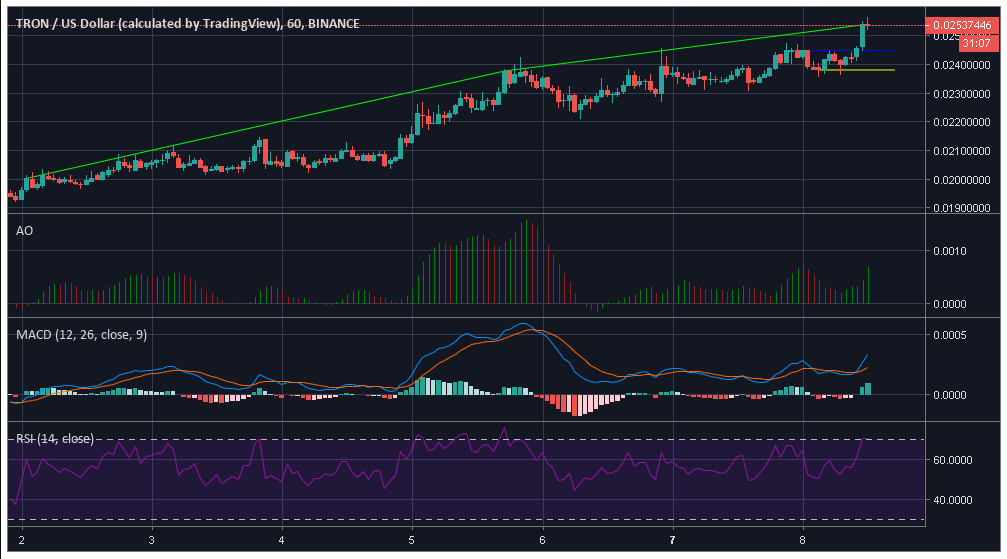
The one-hour chart of the coin observed a massive uptrend from $0.0200 to $0.0237, which continued till $0.0253. There was no significant downtrend observed. The coin broke the previous resistance at $0.0244 and since the coin is still pumping, there is no marked resistance at the time of press. The coin marked support at $0.0238.
Awesome Oscillator predicts a bullish market gaining momentum.
MACD line is above the signal line, indicating a bullish market.
Relative Strength Index indicates that the buying and the selling pressures are evening each other out but the marker is moving towards the overbought zone.
1-day
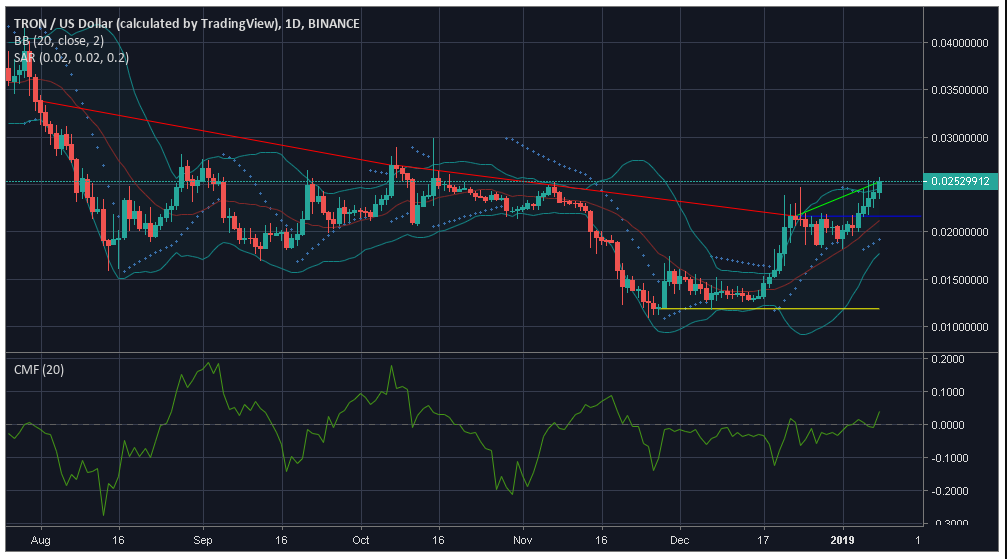
According to the one-day chart, the coin observed a downtrend from $0.0338 to $0.0270, which continued till $0.0216. The coin noted a small uptrend from $0.0216 to $0.0252, with a resistance marked at $0.0216, while the support was noted at $0.0119.
Bollinger Bands appear to be diverged, but have a converging trend to follow. The volatility in the market is high and the moving average line is under the sticks, indicating a bearish market.
Parabolic SAR indicates a bullish market with markers aligning under the candles.
Chaikin Money Flow too, points towards a bullish trend as the marker is above zero.
Conclusion
As per the indicators Awesome Oscillator, MACD, Parabolic SAR, and Chaikin Money Flow the market is summed to be a bullish one. However, Bollinger Bands predict a bearish market underway.


Article comments