Tron [TRX] Technical Analysis: Coin races on the bull in an attempt to overtake Bitcoin SV [BSV]
![Tron [TRX] Technical Analysis: Coin races on the bull in an attempt to overtake Bitcoin SV [BSV]](https://coinhub.news/img/a7/a7102baa205dfd84332fa8b36932e651_730_522.webp)
Ever since the new year, Tron [TRX], the tenth-largest currency in the world, has seen constant growth in its performance. It is now aiming to move way up in the top-10 cryptocurrencies list.
According to CoinMarkeCap, TRX was valued at $0.0231, with a market cap of $1.54 billion at the time of writing. TRX’s market cap is close to that of Bitcoin SV’s [BSV] and might overtake it to be on the ninth position instead of tenth.
The coin registered a 24-hour trade volume of $135 million, with a rise in growth percentage by 2.90% over the past day. The coin has registered an overall growth by 17.91% over the past week and is continuing to grow by 0.43% in the past hour.
1-hour
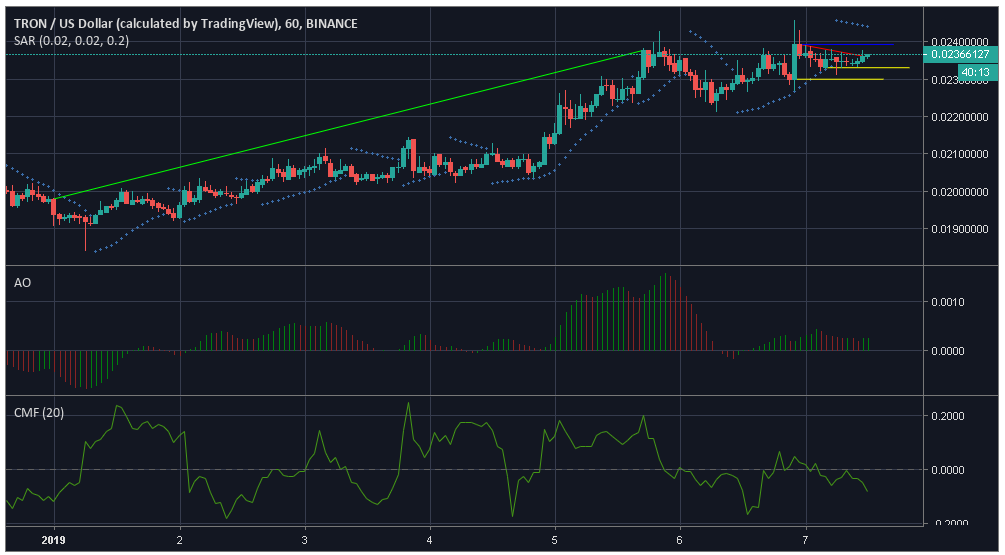
According to the one-hour chart of the coin, a sharp uptrend was noted from $0.0197 to $0.0237, after which it recorded a miniscual fall from $0.0239 to $0.0236. The coin’s resistance is marked at $0.0239 and immediate support is noted to be at $0.0233. The coin marks a second support at $0.0229.
Parabolic SAR marks a bearish market as the markers have aligned above the candles.
Awesome Oscillator too marks a bullish market gaining momentum.
Chaikin Money Flow, on the other hand, points towards a bearish market as the marker dips under zero.
1-day
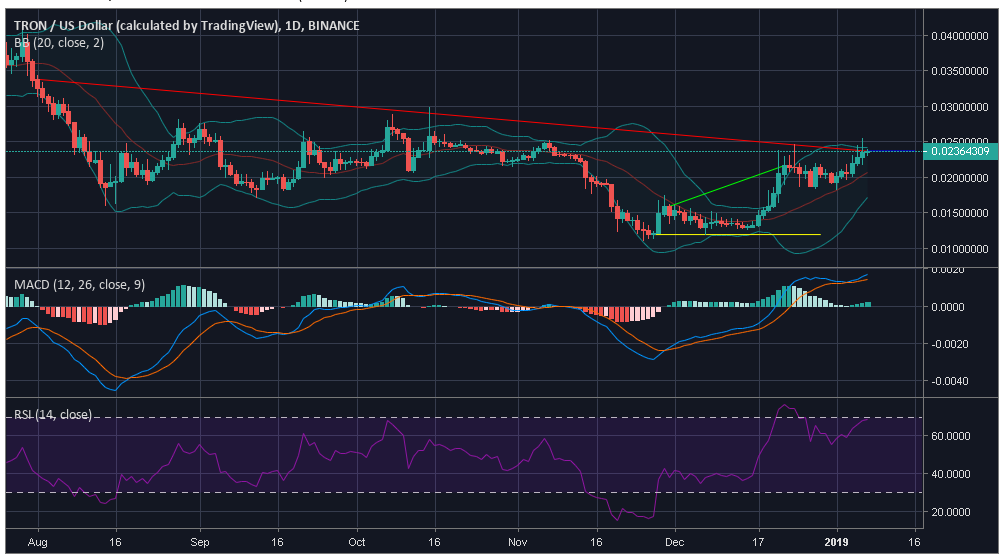
As per the one-day chart of the coin, a downfall was marked from $0.0338 to $0.0236. The coin did not register a significant uptrend. The coin marked resistance at $0.0237 while noting a support at $0.0119.
Bollinger Bands are at a diverged point but will soon converge, thus decreasing the volatility in the market. The moving average line is under the candlestick, marking a bearish market.
MACD line is over the signal line, pointing towards a bullish market.
Relative Strength Index indicates that the buying and the selling pressures are evening each other out.
Conclusion
As per the indicators Awesome Oscillator, and MACD, a bullish market is predicted. However, Bollinger Bands, and Chaikin Money Flow point towards the bear’s reign.


Article comments