Tron [TRX] Technical Analysis: Bull pushing strong to power down bear in the short-term
![Tron [TRX] Technical Analysis: Bull pushing strong to power down bear in the short-term](https://coinhub.news/img/d3/d3593ac55350c1a064d0ce1a32506e12_730_522.webp)
Tron [TRX] seems to be gradually recovering from the clutches of the bear and is now hovering around the $0.0241 mark. However, the long-term looks bleak with the prices failing to break the resistance for quite some time now.
The short-term presents a brighter future as a temporary bullish trend seems to be slowly emerging.
The eleventh largest cryptocurrency had recently crossed Ethereum in the number of daily transactions and had registered a trade volume of $81.26 million over the last 24 hours, with a market cap of $1.59 billion.
1-hour
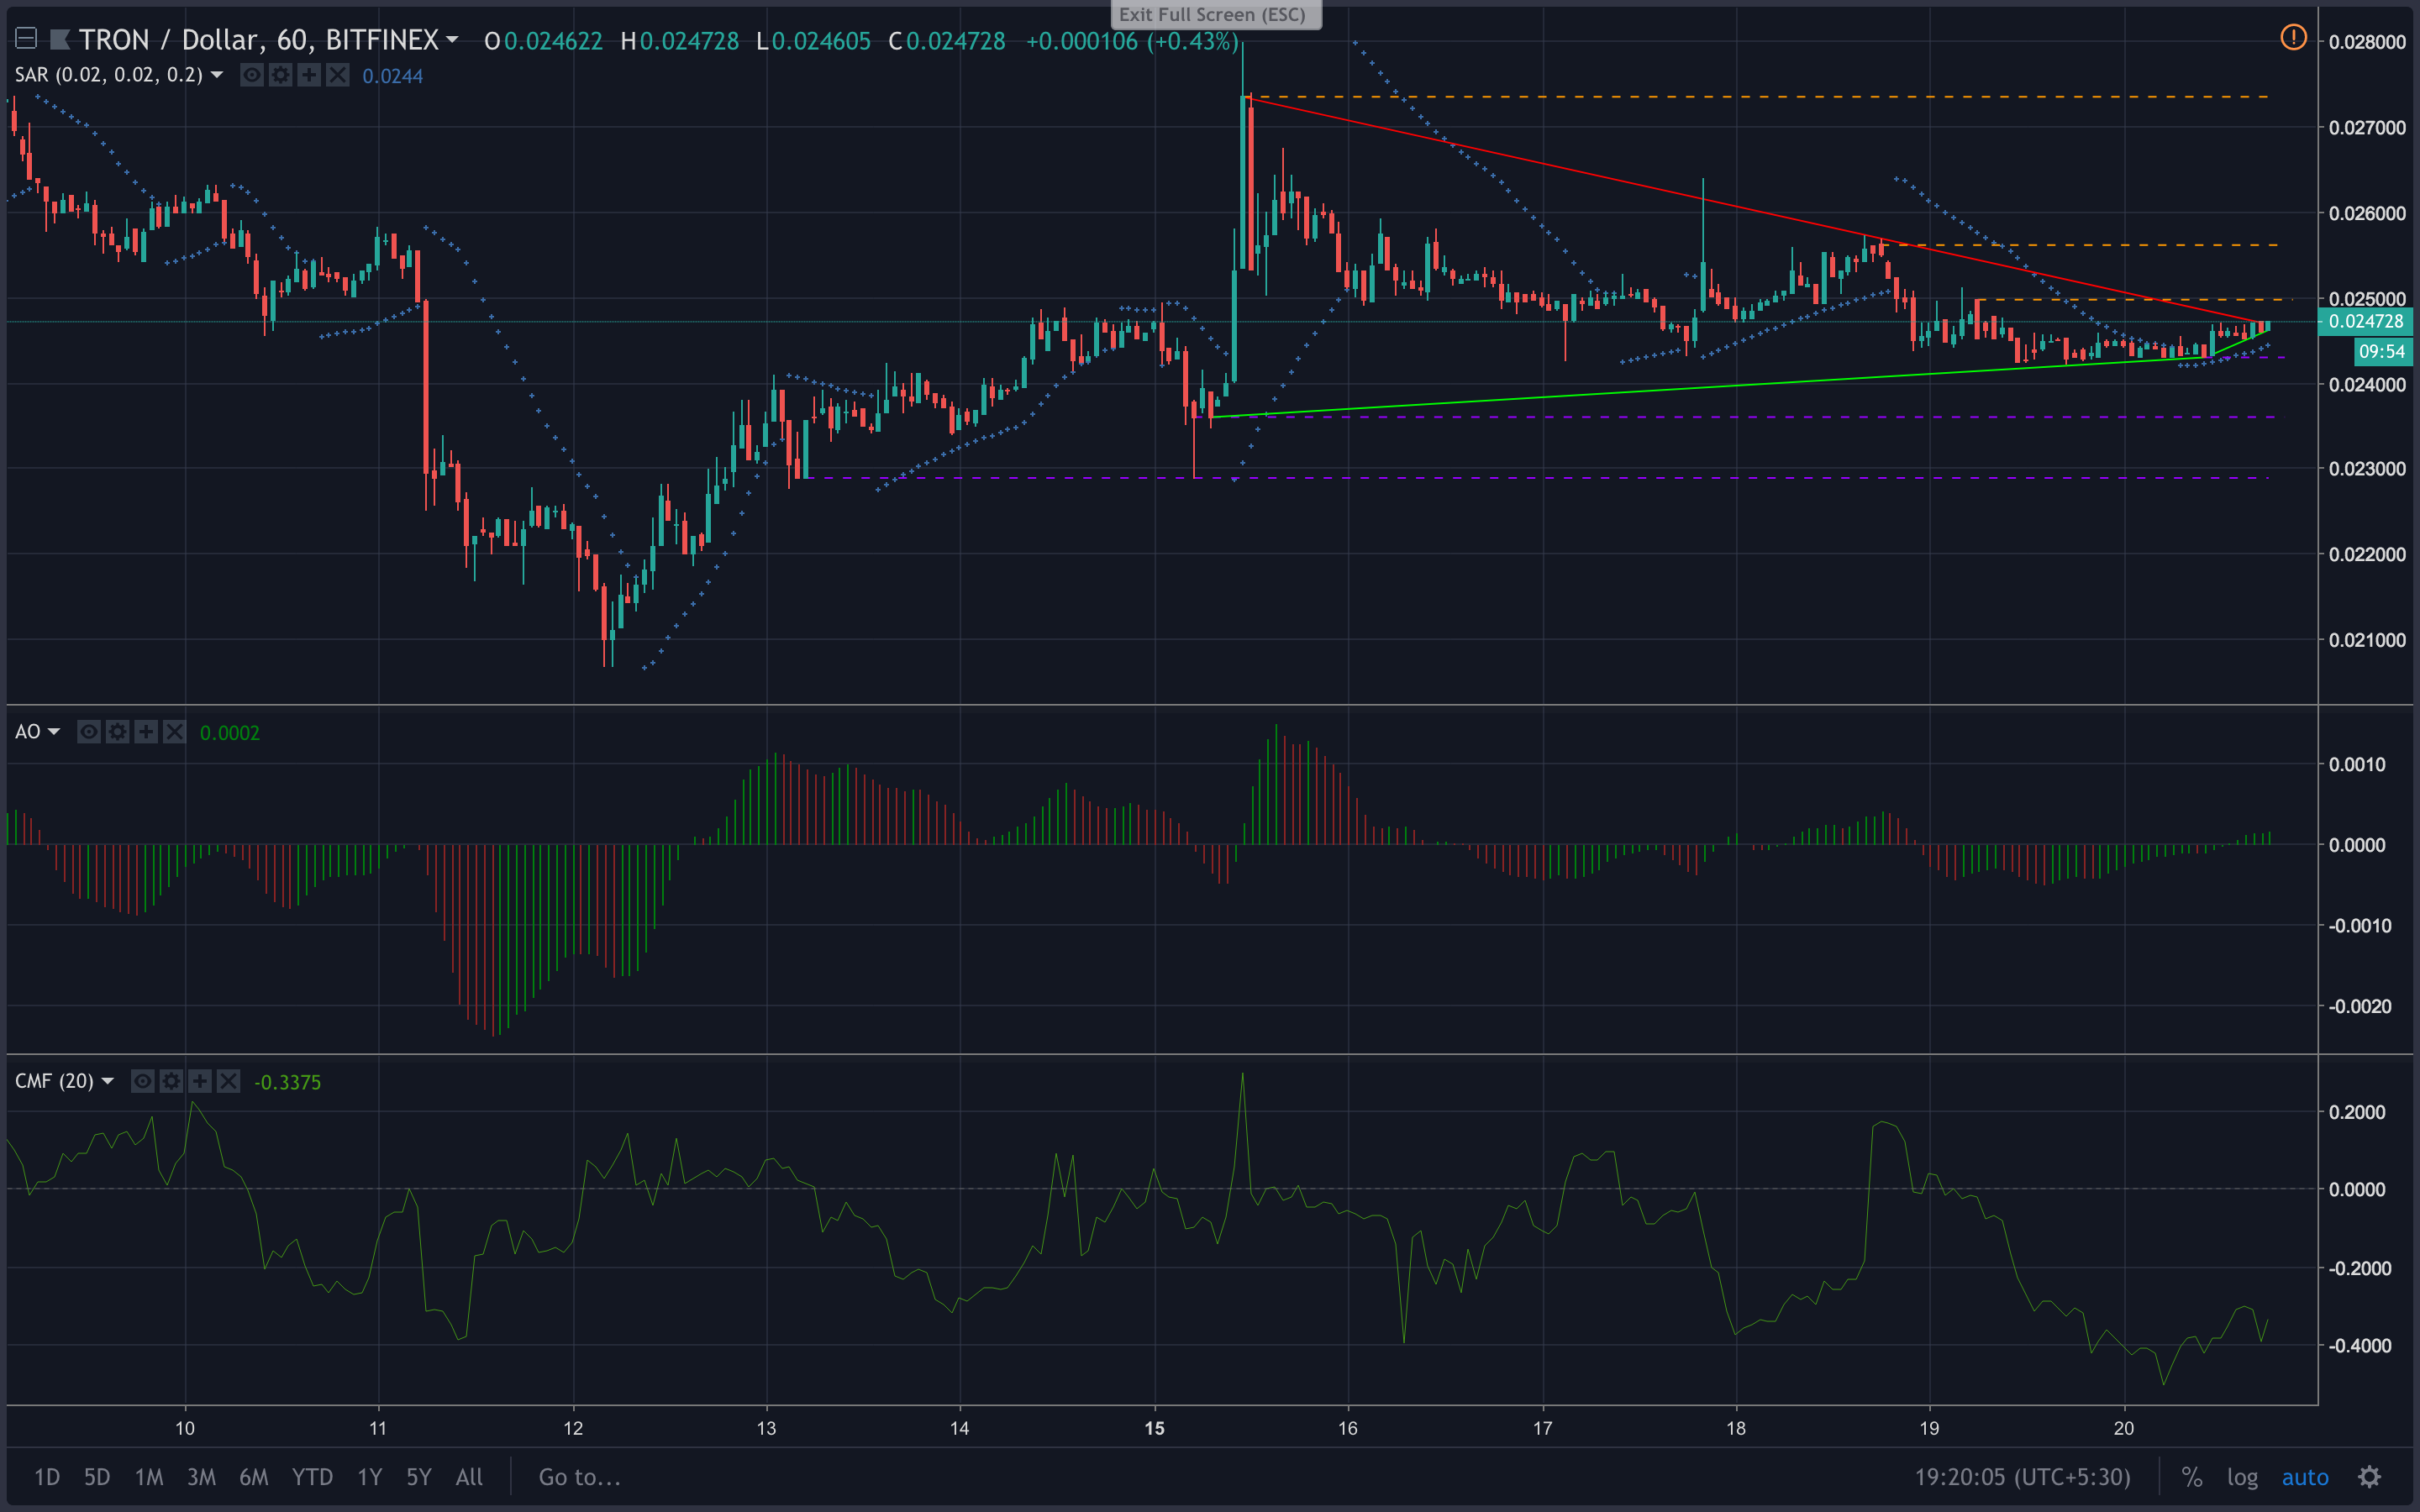
The one-hour graph of TRX shows a downward trend from $0.0273 to $0.0247 between October 15 and October 20, 2018. This trend line has resulted in a change in the support, which now lies inside the upward trend from $0.0236 to $0.0243. A short-term upward trend from $0.0243 and $0.0246 has now emerged on October 20, 2018.
The Awesome Oscillator has made a drastic shift from -0.0004 to +0.0002 and is mostly green. This indicates a strong bullish trend.
The Chaikin Money Flow currently stands at -0.4000 after a sharp dip from 0.1697. This indicates that money is flowing out of the market and points at a bearish trend.
The Parabolic SAR dots have aligned under the candlesticks in the short-term, indicating a bullish market.
1-day
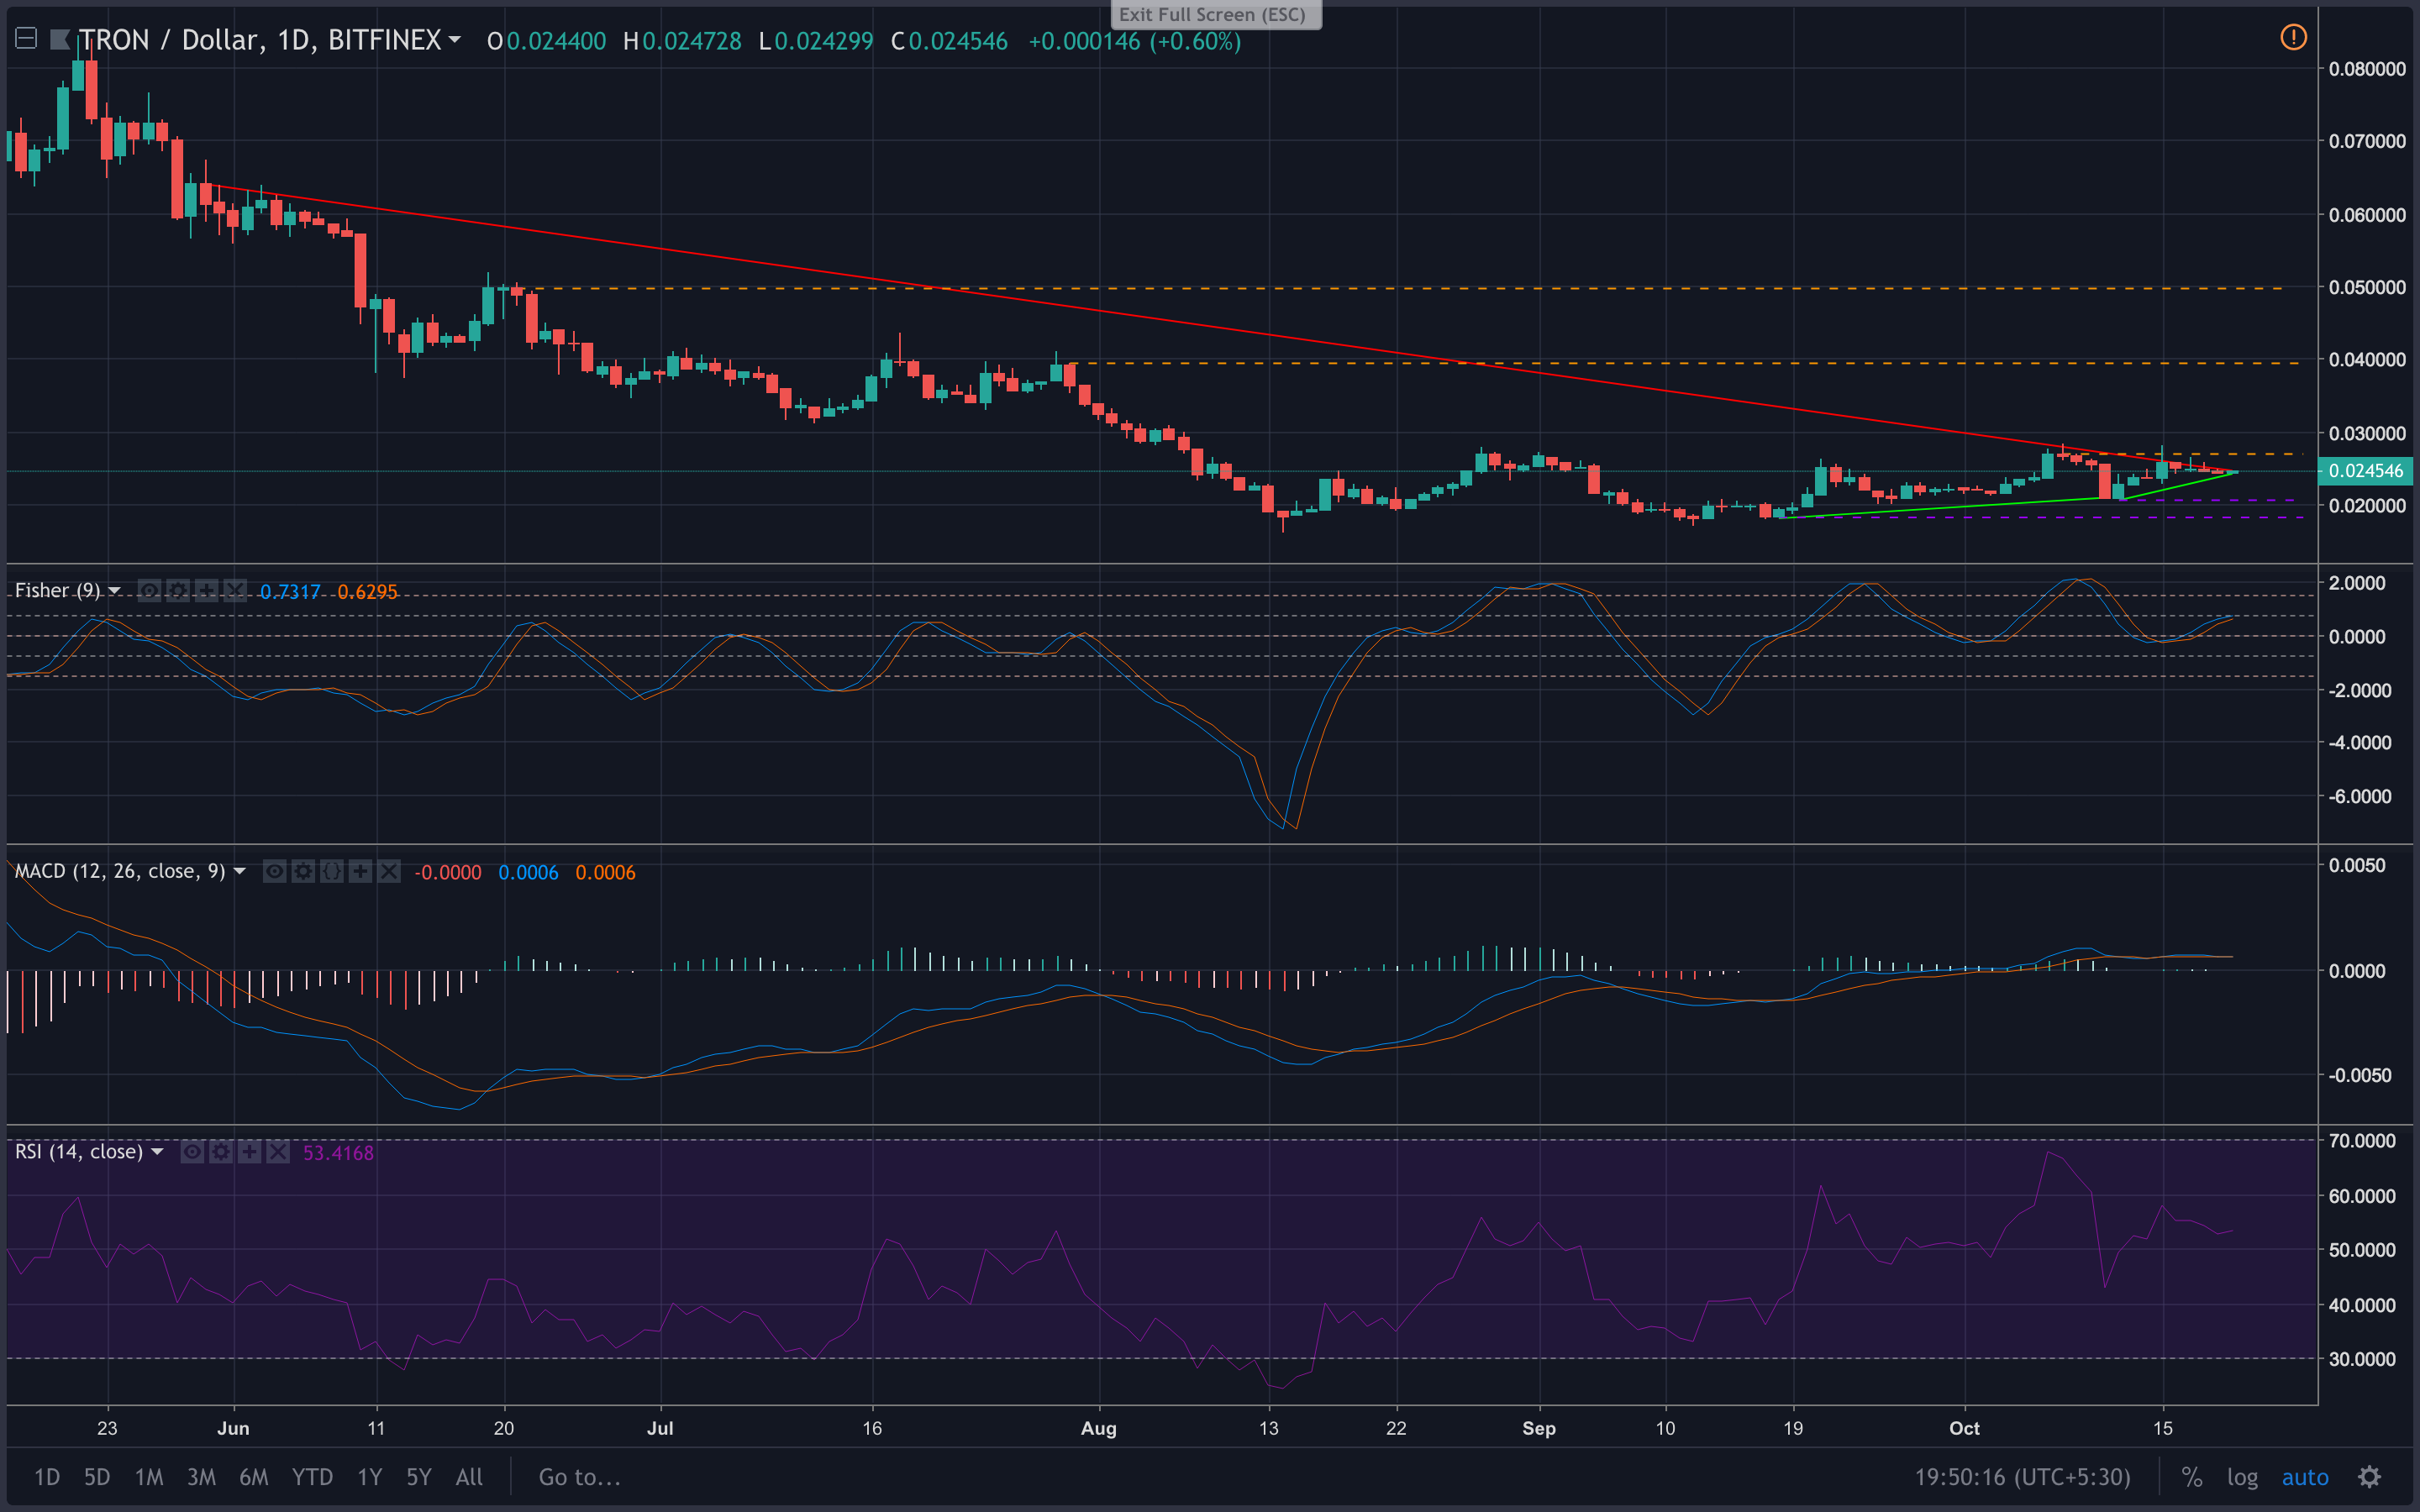
The one-day graph shows a strong downward trend from $0.0640 to $0.0257 between May 30 and October 16, 2018. The downtrend continues from $0.0257 to $0.0247 between October 16 and October 20, 2018.
An upward trend is seen from $0.0181 to $0.0210 between September 18 to October 11, 2018. A similar drift is seen between October 12 and October 20, 2018, as the price moved from $0.020 to $0.024.
The Fisher Transform chart shows the Fisher line climbing uphill, crossing the trigger line on October 15. This points at a bullish environment. However, the Fisher line now has a slight drift towards the bottom now, indicating an imminent bear attack.
The MACD chart shows the moving average climbing downhill, crossing the signal line on October 19, 2018. This indicates a bearish market.
The RSI fails to give a sharp indication of the market trend as it shows the token recovering from a slightly oversold position. Now, the buying and selling pressure seems to have stabilized and are countering each other.
Conclusion
In the short-term, a bullish market seems to be prevailing, as indicated by the Awesome Oscillator, and the Parabolic SAR. If this trend actualizes, the resistances will be at $0.0249 and $0.0256.
If the prices are to drop as indicated by Chaikin Money Flow, the support will be at $0.0243 and $0.0236.
In the medium to long-term, a bearish market seems to be in place, as indicated by the MACD and RSI charts. If the bearish market prevails, support will be at $0.020 and $0.018.
If the market gives way to a bullish environment as indicated by the Fisher Transform chart, the resistance will be at $0.026 and $0.018.


Article comments