Stellar Lumens [XLM/USD] Technical Analysis: Short-term relief imminent, but bears still in control of market
![Stellar Lumens [XLM/USD] Technical Analysis: Short-term relief imminent, but bears still in control of market](https://coinhub.news/img/f9/f9b1ea649024fd09bba3d0d81c471fbb_730_522.webp)
Stellar Lumens [XLM] overtook Bitcoin Cash [BCH] and gained the fourth-largest cryptocurrency temporarily while there was a squabble in the Bitcoin Cash community. XLM, in the seven-day chart, has decreased by 18.56%.
The current price of XLM is $0.2021, while the market cap is at $3.87 billion. The 24-hour trading is holding steady at $128.06 million. Binance contributes 25% with trading pairs XLM/USDT and XLM/BTC.
Binance is followed by Upbit, a Korean exchange, that provides 11.39% of the trading volume in trading pair XLM/KRW.
1-hour
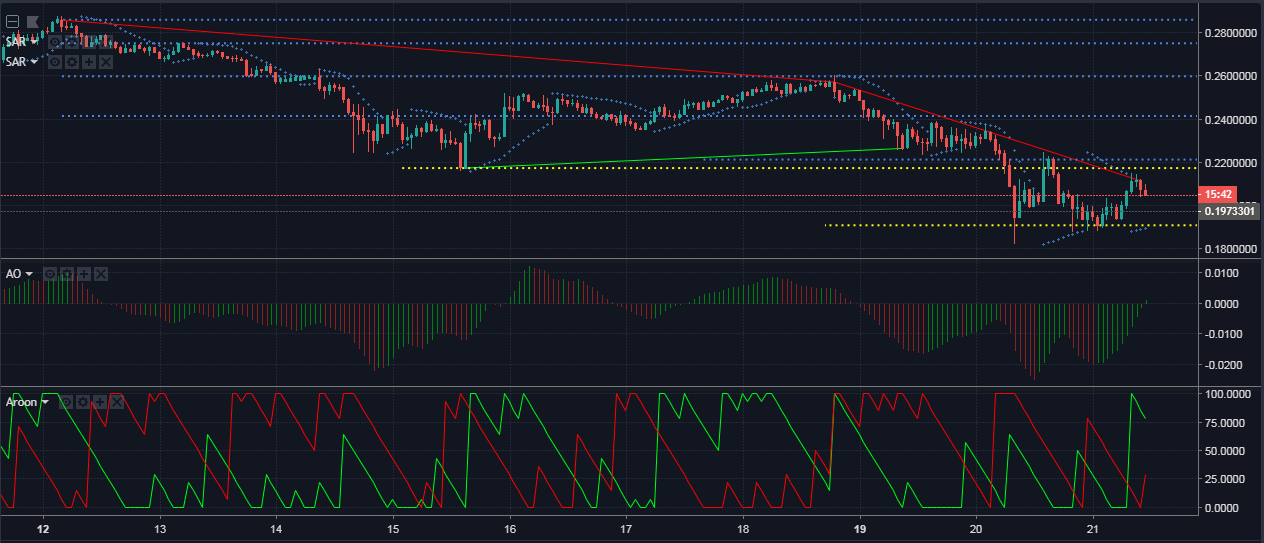
The prices in the one-hour time frame show a downtrend that extending from $0.2856 to $0.2114. The support at $0.2173 has been breached and new support is set up $0.1909. Resistance points are set up at $0.2212, $0.2413, $0.2597, $0.2749, and $0.2858.
The Parabolic SAR markers have spawned below the price candles indicating a bullish trend incoming.
The Awesome Oscillator is showing a bullish crossover as green lines have originated above the zero line.
The Aroon indicator shows a trend reversal as the Aroon up line has hit the 100 line, indicating that the uptrend is underway.
1-day
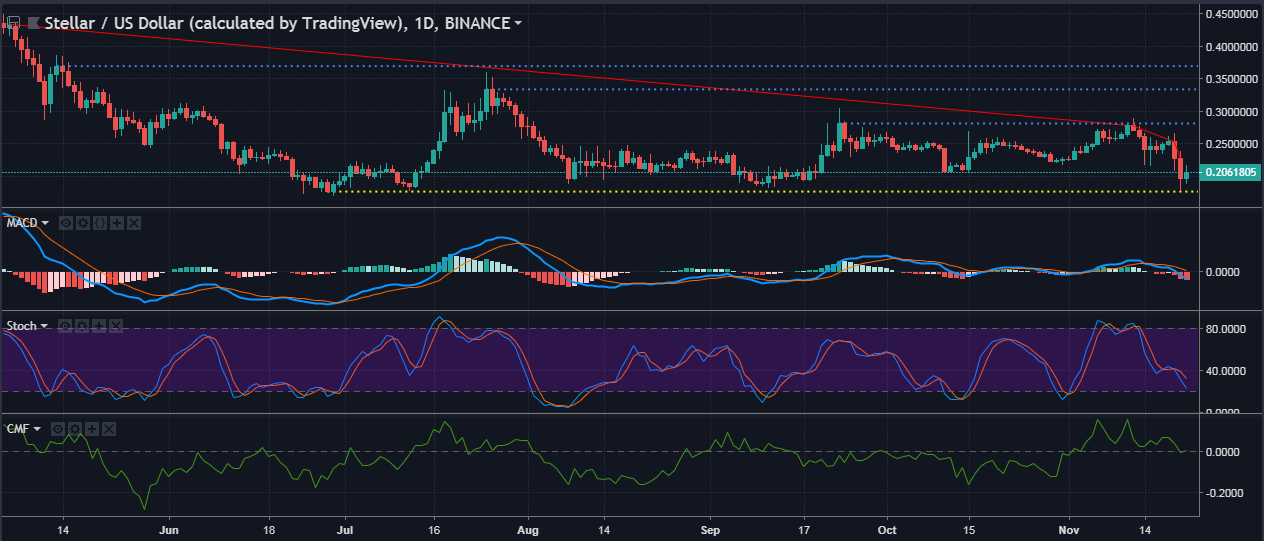
With no uptrend in sight, the downtrend ranges $0.4305 to $0.2277 as the prices dip further down. The prices have broken the support at $0.2275 and set a new support at $0.1768. Resistance points are set up at $0.2813, $0.3336 and $0.3693.
The MACD line has crossed over the signal line, undergoing a bearish crossover. The zero line has red bars hanging over to the bottom indicating a bearish signal.
The Stochastic line has touched the 20 line, indicating an oversold market.
The CMF can be seen hanging at the zero line, which indicates that the money inflow and the outflow are the same.
Conclusion
The indicators in the one-hour chart show a bullish trend altogether. The one-day chart shows a bearish trend occurring for Stellar Lumens which otherwise is indicated by MACD, Stochastic, and CMF.


Article comments