Stellar Lumens [XLM/USD] Technical Analysis: Bull has completed its rally in the market?
![Stellar Lumens [XLM/USD] Technical Analysis: Bull has completed its rally in the market?](https://coinhub.news/img/73/73679d6534c7c8293b3a58e64a23e4c2_730_522.webp)
Stellar Lumens, the sixth-largest cryptocurrency, has been setting the market ablaze with its latest announcements. The coin also broke through the bear’s grip earlier this week along with all the major altcoins such as XRP, Ethereum [ETH], and Bitcoin Cash. However, it seems like the bear has caught hold of the market again as all coins started to bleed red.
According to CoinMarketCap, at press time, the coin was trading at $0.252 with a market cap of over $4 billion. The coin has a trading volume of more than $73 million and had dipped by over 2% in the past 24 hours.
1-hour:
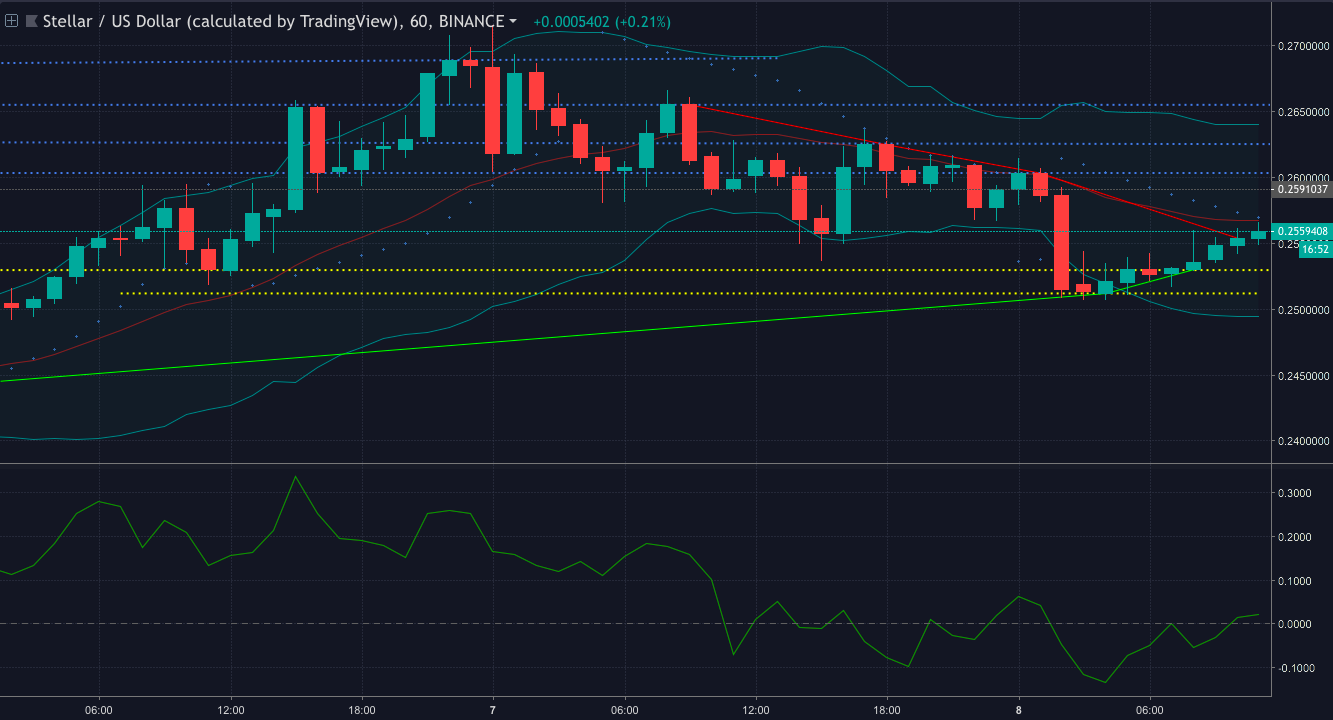
In the one-hour chart, XLM had a strong resistance level at $0.265 and an immediate resistance was spotted at $0.260. The cryptocurrency had an immediate support at $0.252. If this were to be breached, then the next help support would be at $0.251 i.e., strong support.
The Parabolic SAR indicator predicted that the bear’s grip is stronger than imagined, as the dots were aligned above the candlesticks.
Chaikin Money Flow showed that the money was flowing into the market, showing its support for the bull.
The Bollinger bands were also showing that the market was volatile as the bands were expanding, making room for price movements.
1-day:
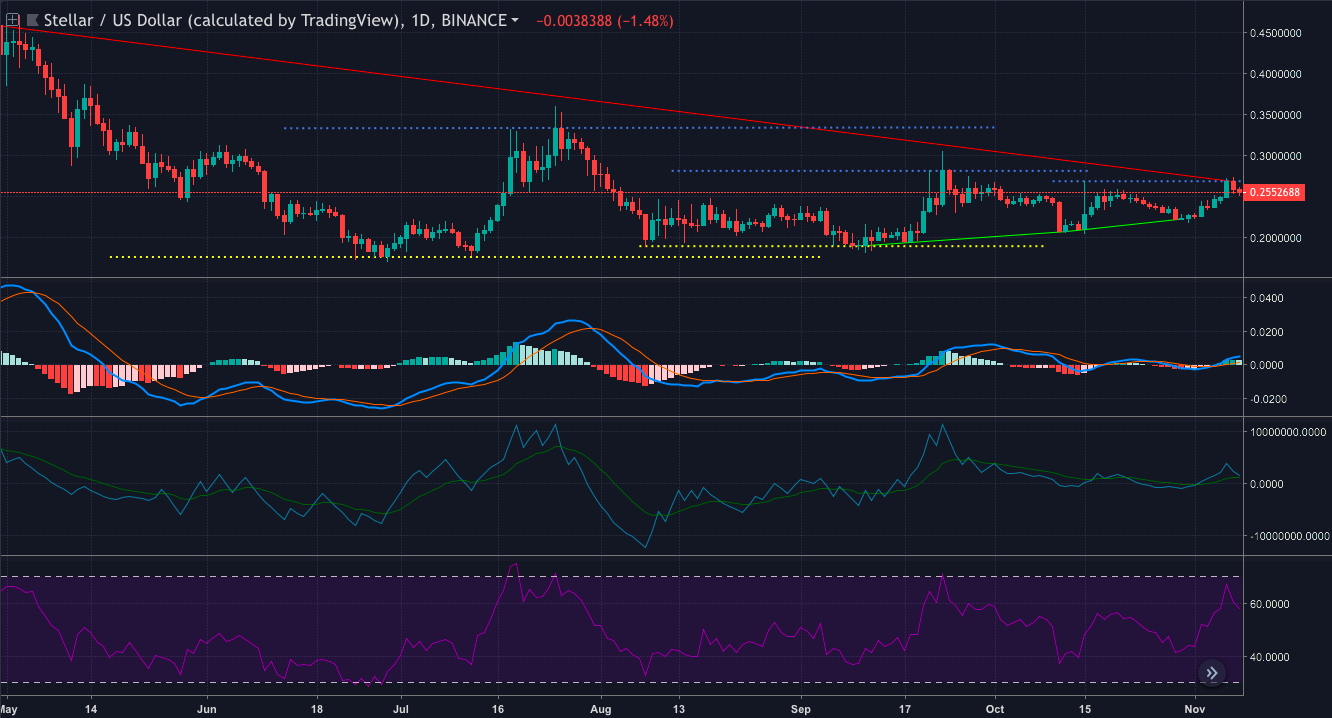
The one-day chart showed the coin’s strong resistance at $0.45, which was placed at the end of April 2018. There was also an immediate resistance at $0.26, with an immediate support at $0.22. The coin also had a strong support at $0.17, if the bear decided to take over the whole market.
The RSI indicator showed its support to the bear as the coin was just recovering from the overbought zone.
However, MACD depicted that the bull had a chance of turning the game, as the MACD line was above the signal line.
Klinger Oscillator was leaping in for dive after a bullish race, as the reading line showed that it could breach below the signal line.
Conclusion
The coin could be held by the bear for a longer duration as the Parabolic SAR from the one-hour chart, RSI and the Klinger Oscillator swore its allegiance to the winter soldier. Nonetheless, MACD and CMF continued to stay by the bull, showing that the game could turn over soon.


Article comments