Stellar Lumens [XLM/USD] Technical Analysis: Altcoins buckle under immense pressure of the bear
![Stellar Lumens [XLM/USD] Technical Analysis: Altcoins buckle under immense pressure of the bear](https://coinhub.news/img/d6/d6e00666445aaeb8a9314f94fb1146ae_730_522.webp)
Stellar Lumens [XLM], like all the altcoins in the crypto space, have been under the bear’s extreme pressure. There haven’t been any developments in the community except for the recent Starlight payment channel development, that has given the community a sense of hope.
1-hour
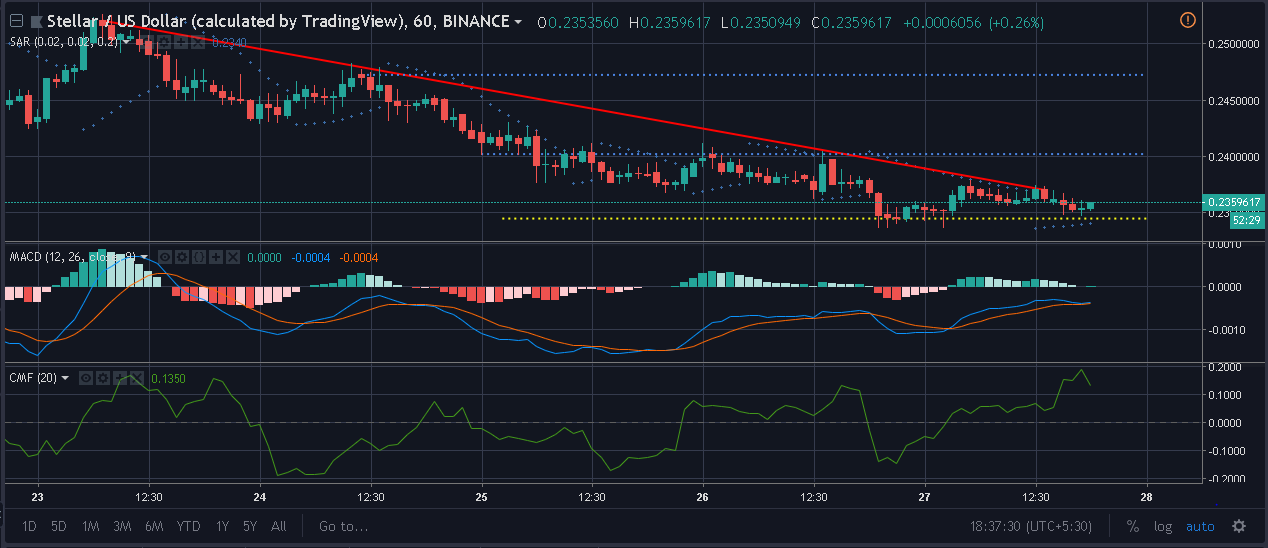
Parabolic SAR markers are below the candles in this bear market indicating a bull presence in the hourly chart.
MACD line is hugging the signal line indicating a possible crossover to the bottom.
Chaikin Money Flow indicator topped out today on October 27 and has been going down since, indicating that the money is going out of the market.
1-day

Support can be seen at $0.1899 and successively at $0.1769. Short term resistance is set at $0.2812.
The candles in the 1-day chart are on the exponential moving average while the Bollinger Bands, however, are close to each other indicating the decrease in volatility.
The Stochastic indicator has crossed the signal line towards the bottom, indicating a bearish crossover.
The RSI has been at the centre for quite a while and is tilting towards the bottom.
Conclusion:
In the 1-hour chart, the Bollinger bands, as well as the Stochastic lines, indicate a bearish move of the market, while the RSI indicator is at the centre indicating even buy and sell pressure. The Parabolic SAR indicates a bullish move, while both Chaikin Money Flow indicator and the MACD indicate a bearish move.


Article comments