Monero [XMR/USD] Technical Analysis: The bulls rest after a weary conquest from the bulls
![Monero [XMR/USD] Technical Analysis: The bulls rest after a weary conquest from the bulls](https://coinhub.news/img/e7/e7f174d010c3fd7df3cd3816880dcc5c_730_522.webp)
The price of Monero at press time was at $109.78, with a market cap of $1.8 billion. Monero has been seeing a lot of sideways movement after the spike on November 4. Trade volume of Monero is vastly obtained from Bithumb, which contributed a total of 97.18% of the total volume of the token. The privacy token experienced a 5.75% increase in a span of 7 days.
1 Hour:
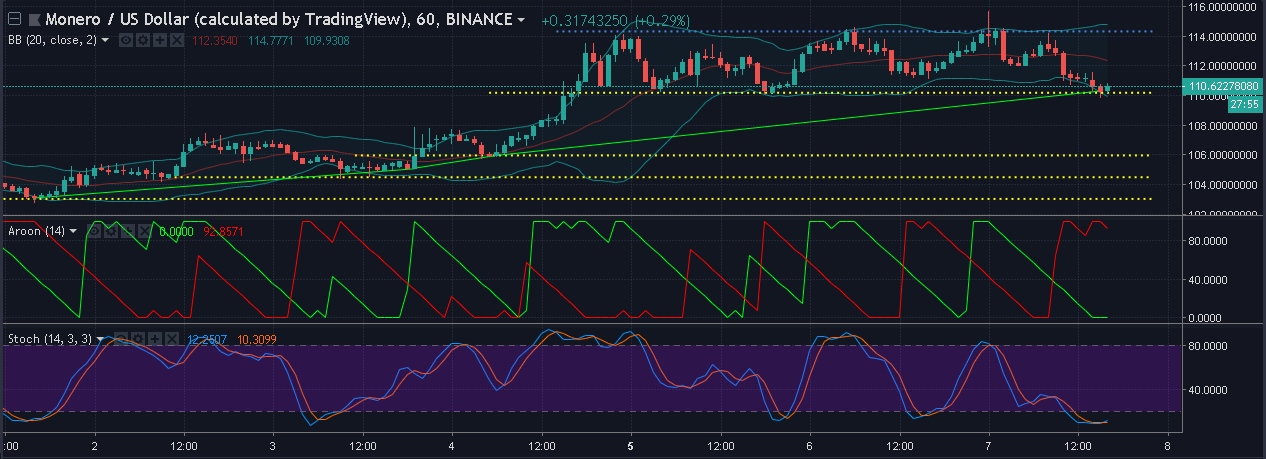
Even though the privacy token has been trailing along with the sideways market in the shorter time frame, there is an uptrend that ranges from $103.09 to $110.29. The downtrend has essentially vanished from the shorter time frame. The coin has been trying hard to break the resistance set up at $114.31 but has seen no fruition. Several supports were formed during its ascend, while the most recent support is set up at $110.17, consecutively $105.96, $104.49, and $103.03.
The Bollinger Bands indicates a period of consolidation as the bands aren’t expanding or contracting in a significant amount. The prices, however, have fallen below the EMA line indicating a bearish trend hovering over in the markets.
The Aroon up line has crossed the Aroon downline indicating a trend reversal happening and the market is following a bearish trend.
The Stochastic Oscillator has bottomed the oversold market and the Stochastic line has just crossed over the signal line indicating that a bullish trend is imminent.
1 Day:
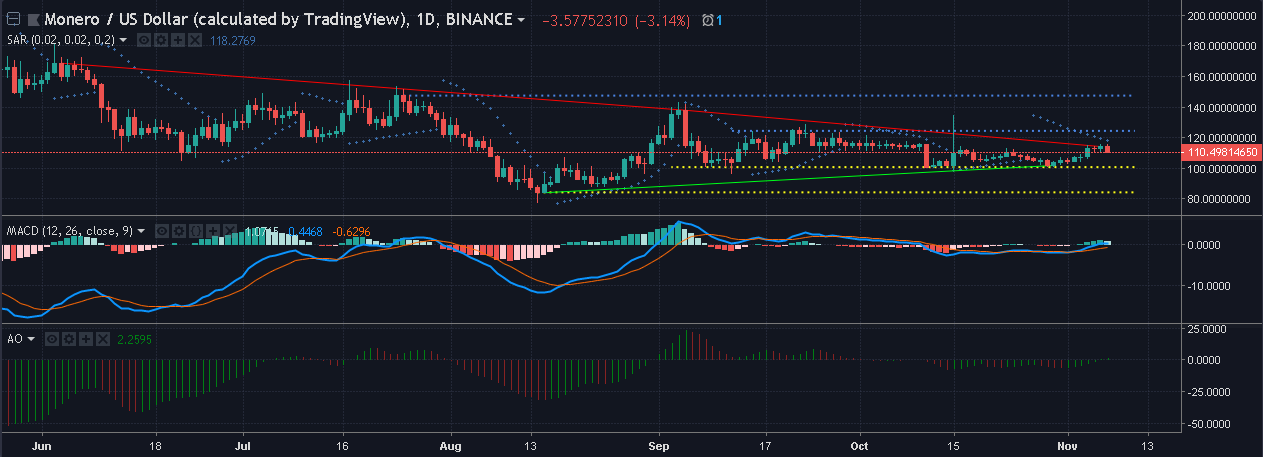
Unlike the one-hour chart, the downtrend is still prevalent in the one-day chart, and it ranges from $168.68 – $137.89 – $114.12. There is an uptrend as well that ranges from $83.94 to $101.77.
The Parabolic SAR markers are indicating a bullish trend. Their strength is dissipating as they are on a collision course with the candles.
The MACD indicator is starting to show bullish signs as the MACD line has just crossed over the signal line.
The Awesome Oscillator shows green spikes starting to form over the zero line a bullish presence looming.
Conclusion:
The markets for Monero in the one-hour time frame indicate a bearish move as prices take a step down. The MACD and AO indicators in the one-day chart show bullish momentum while the Parabolic SAR seems to be indicating a bearish pressure.


Article comments