Monero [XMR/USD] Technical Analysis: Bulls seek recluse as bears take over
![Monero [XMR/USD] Technical Analysis: Bulls seek recluse as bears take over](https://coinhub.news/img/99/9904509d15f17fc49b77a04a6a901ceb_730_522.webp)
Monero, the ninth-largest cryptocurrency, is currently trading at $106.60, with a market cap of $1.75 billion. The trading volume of XMR is $13.13 million, with 97% of it being contributed by Bithumb.
1-hour
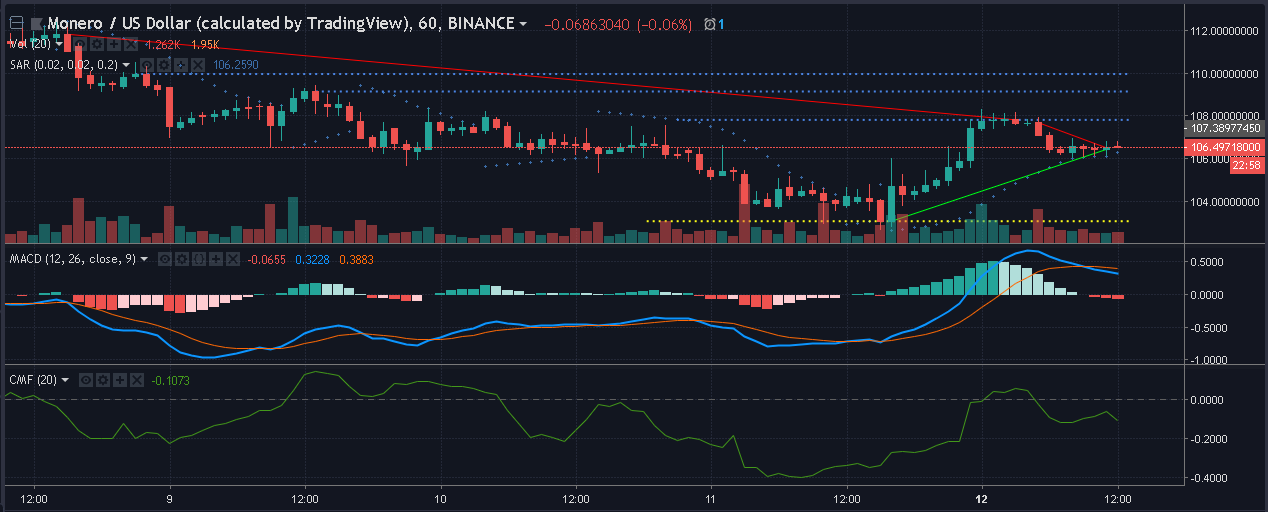
There seems to be an uptrend spawning in the one-hour charts for Monero. The uptrend ranges from $103.05 to $106.41, while the downtrend ranges longer than the uptrend as it spawns from $111.82 to $107.80. The support at $103.05 is holding strong and the price is holding steady. The immediate resistance is set up at $107.80 while the subsequent resistances are set up at $109.13 and $109.95.
The Parabolic SAR indicates a bullish run in the shorter time frames as the markers are forming below the candles.
The MACD indicating a bearish move as seen from the bearish crossover. The MACD histogram has also reversed indicating the same.
The Chaikin Money Flow is also indicating a bearish move as the line is dipping to the bottom.
1-day
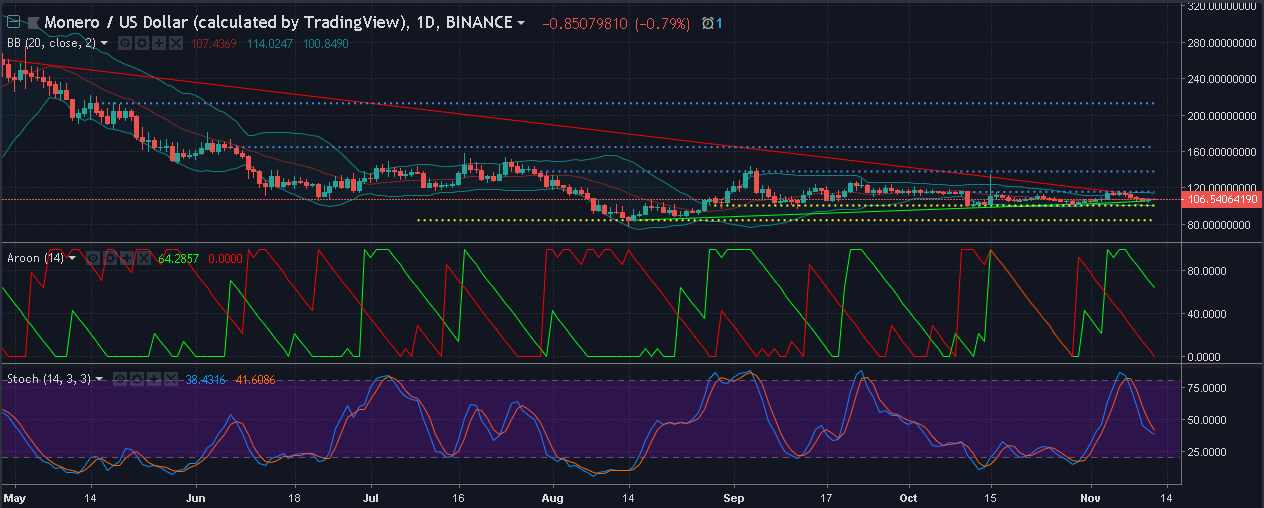
Unlike other cryptocurrencies, a small uptrend can be seen on Monero’s chart. The uptrend spans from $84.20 to $105.45. The downtrend is significant due to its stretch from April, the price ranges from $261.16 to $114.07. There are two supports, one at $100.52 where the prices bounced off twice. The next support is spawned at $84.20. The prices have set new resistance at $115.58. The next resistance points are set up $137.89, $164.37, and $212.87.
The Bollinger Bands are indicating a bearish trend as the prices are tumbling below the simple moving average indicating that the sellers are controlling the market.
The Aroon indicator shows that the downtrend has lost strength, while the uptrend has gained strength after the crossover.
The Stochastic indicator shows clearly shows a bearish crossover as the stochastic line saturated at the top, signaling that the markets are oversold. The lines have undergone a bearish crossover.
Conclusion
The charts show a gloomy future for Monero as MACD and CMF indicate the same. Only the Parabolic SAR indicates otherwise. The larger time frame i.e., the one-day chart, shows a bearish overall trend as the indicators shows the same.


Article comments