Monero [XMR/USD] Technical Analysis: Bear continues to loom over the market despite bull’s efforts
![Monero [XMR/USD] Technical Analysis: Bear continues to loom over the market despite bull’s efforts](https://coinhub.news/img/5b/5b67a6b426a3151feb833ce5de3a1622_730_522.webp)
Monero [XMR], the tenth-biggest cryptocurrency by market cap, has been doing relatively well today, in comparison to other coins in space. The coin successfully managed to dodge most of the bear’s bullets and managed to glow green along with Tron [TRX], Bitcoin Cash [BCH], and Dash.
According to CoinMarketCap, at press time, Monero is trading at $65.35 with a market cap of $1.08 billion. The coin has a trading volume of $13.08 million and demonstrates a downfall of 24.06% in the past seven days.
One-hour:
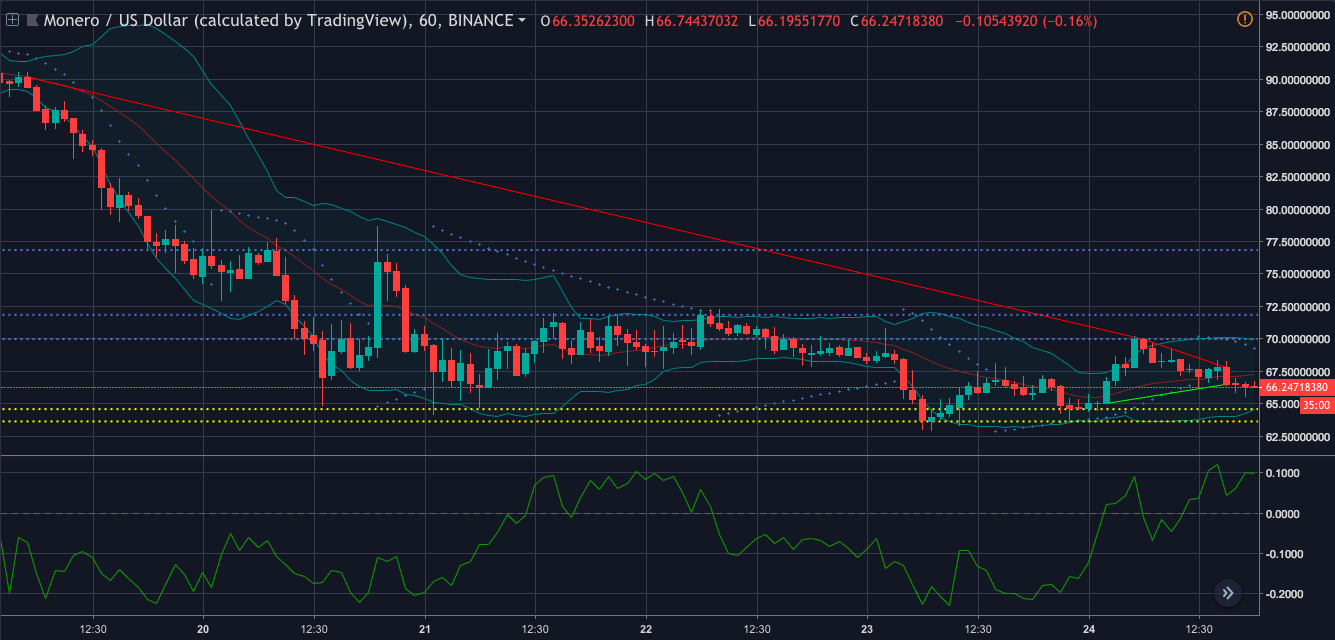
In the one-hour chart, the cryptocurrency demonstrates a downtrend from $90.15 to $69.96 and further slumped to $67.78. It has an uptrend from $65.03 to $66.50. The coin has an immediate resistance at 69.98, after which the next stop level is at $71.85. It has a strong resistance point at $76.84. Monero demonstrates an immediate support at $64.59 and a strong support at $63.64.
Chaikin Money Flow pictures the coin running towards the bull’s realm as the money has started to flow into the market.
Nonetheless, Parabolic SAR is dragging the coin back to the bear’s kingdom as the dots have aligned above the candlesticks.
Bollinger Bands shows that the bands have started to expand in the market, predicting a volatile market for the coin.
One-day:

In the one-day chart, Monero pictures a downtrend from $203.52 to $114.07. It also shows a steep downtrend from $84.20 to $66.07. The chart shows that the coin has not formed a significant uptrend since its plunge in the market. It has an immediate resistance at $114.24 and a strong resistance at $147.44. The coin is currently trading close to its support level, which is set at $65.94
RSI shows that it is cradled by the bear as the selling pressure is more for the coin than the buying pressure.
MACD is also resting in the bear’s kingdom as the moving average line crossed over to take the route downhill.
Klinger Oscillator is along side MACD as the reading line made a crossover to go below the signal line.
Conclusion:
The bear has managed to keep RSI, MACD and Klinger Oscillator from the one-day chart, and Parabolic SAR from the one-hour chart. Nonetheless, the bull is trying draw the attention of CMF from the one-hour chart.


Article comments