Litecoin [LTC/USD] Technical Analysis: Token spews blood as its prices wither away
![Litecoin [LTC/USD] Technical Analysis: Token spews blood as its prices wither away](https://coinhub.news/img/f9/f9a8ab08fb9ecff93a99be60bcd2d80b_730_522.webp)
Litecoin [LTC] prices are crumbling non-stop, breaking long-term supports without hesitations, both in the one-hour and the one-day charts. The market cap for Litecoin is currently hanging by a thread at $1.50 billion, with the current prices trading as low as $25.29.
Once, the seventh-largest cryptocurrency, it is now placed at the ninth rank below Bitcoin SV [BSV] and just above Tron [TRX].
1-hour
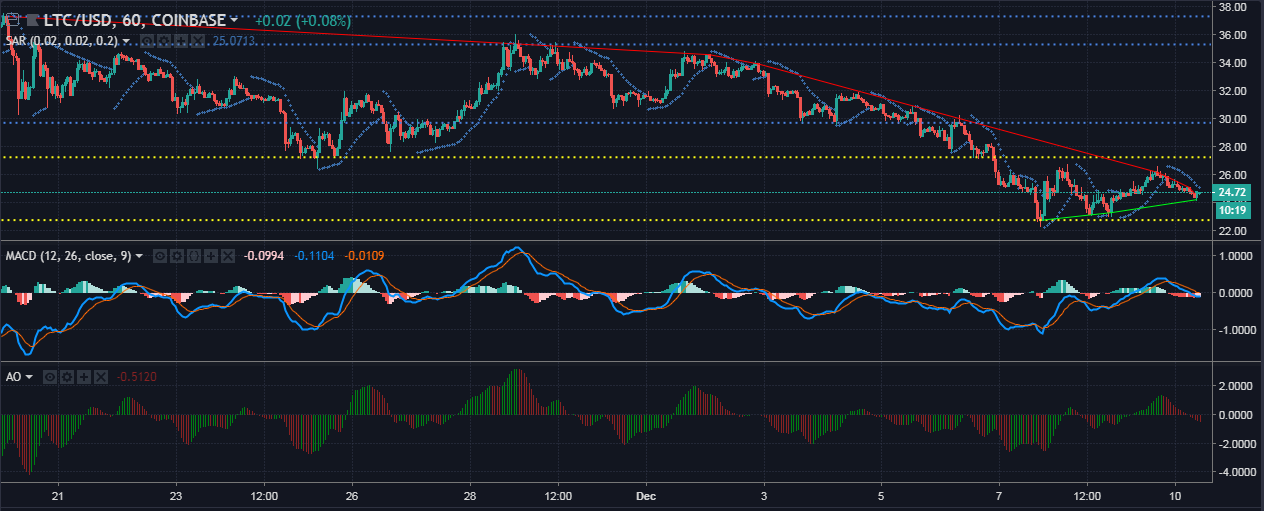
The uptrend for Litecoin, although small, extends from $22.77 to $24.23, while the downtrend is in full swing as it extends from $37.29 to $25.09. Prices for Litecoin have broken the support at $27.25 and set up a new support at $22.77. The resistance points are seen hanging at $29.70, $35.29, and $37.29.
The Parabolic SAR markers have formed above the price candles, which indicates a bearish presence hanging over the market.
The MACD indicator also shows a bearish presence as the MACD line has crossed over the signal line to the bottom.
The Awesome Oscillator shows a bearish crossover as the red bars are moving from above the zero-line to the bottom of it.
1-day
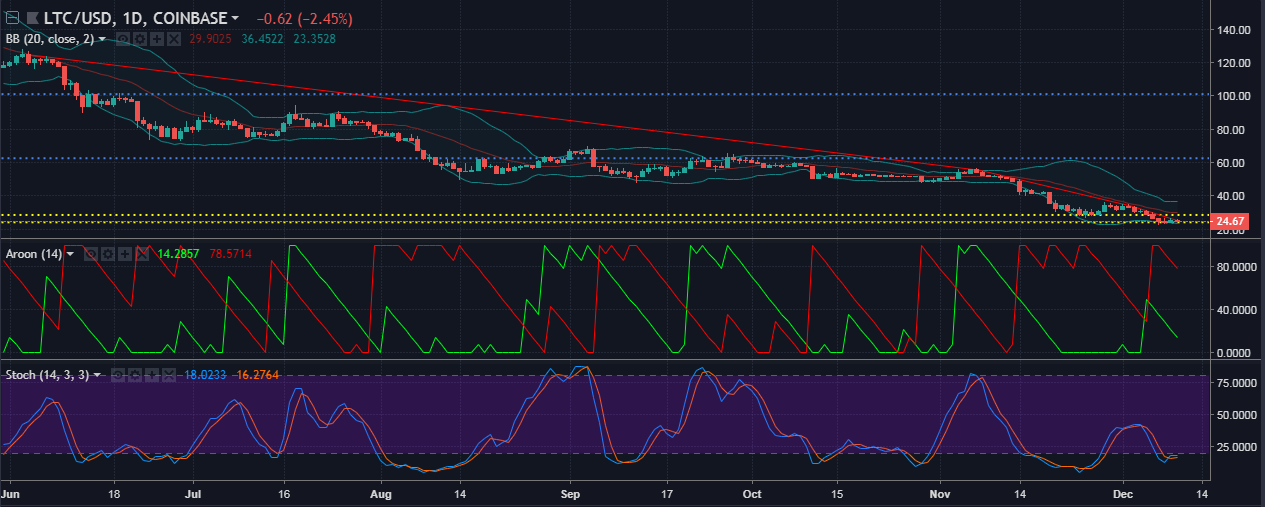
In the one-day chart, the downtrend extends from $124.76 to $25.29, with no uptrend in sight whatsoever. Even in the one-day chart, the prices have broken support at $28.60 and set new support at $24.19. The resistance points are set up at $62.63 and $101.11.
The Bollinger Bands for the LTC prices in the one-day time frame depicts an on-going squeeze, which is typically a period of less volatility and the prices are in the oversold zone.
The Aroon indicator shows that the downtrend is in full swing as the Aroon down-line has hit the 100-line, while the Aroon-up line is at the bottom.
The Stochastic indicator shows mirroring of the bear market as the stochastic lines have dipped too deep in the oversold zone, and are still in it.
Conclusion
The indicators in the one-hour chart show a bearish aura hanging around Litecoin cryptocurrency. The Bollinger Bands, Aroon and the Stochastic, all indicate a bearish downtrend for Litecoin.


Article comments