Litecoin [LTC/USD] Technical Analysis: The bulls to thrive in the green zone
![Litecoin [LTC/USD] Technical Analysis: The bulls to thrive in the green zone](https://coinhub.news/img/56/56961aaea944791c61224ad08a89effa_730_522.webp)
The cryptocurrency market has taken a volatile approach again where all the big coins are acting out in their way post a sideways haul.
At the time of writing, Litecoin [LTC], the seventh largest coin in the world was trading at $54.22 with a market cap of $3.2 billion. The coin was floating in the green zone and was up by 1.22% with a total 24-hour trading volume of $371 million.
1-hour:
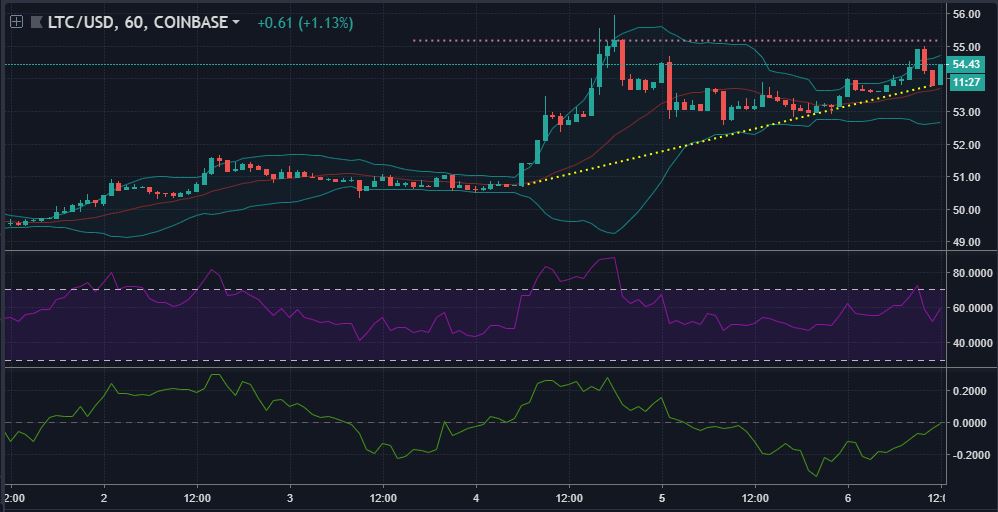
In the 1-hour LTC chart, the candlesticks are seeing the resistance level set at $55.2. The support line is extending from $50.73 to $53.81, marking a rally in the Litecoin price trend. However, a trend breakout is not visible as of yet.
The Bollinger Bands are widening its gap to give rise to market volatility. It is evident that the Litecoin market is going to fluctuate more vigorously than before.
The RSI bounced back after crashing into the overbought zone and is currently taking an uphill road again. Hence, the indicator is bullish on LTC price trend.
The Chaikin Money Flow has given a nod to the above prediction and is climbing up to cross the 0-mark.
1-day:
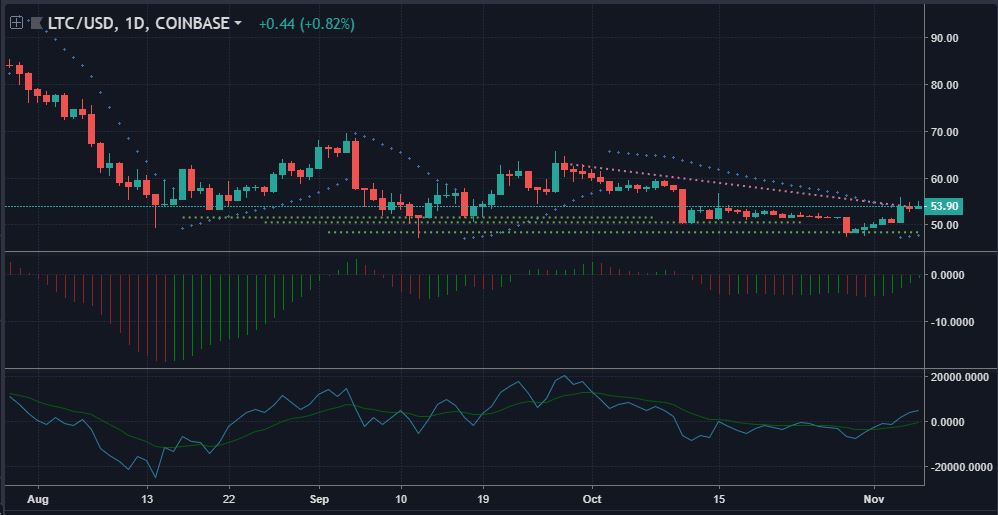
In this scenario, the downtrend is ranging from $63.22 to $53.97 whereas the support is set at $48.47. Since September, Litecoin has broken two major supports set at $51.58 and $50.55, respectively. The candles are forming a descending triangle in the LTC market, detecting a severe downtrend.
The Parabolic SAR is bullish on the cryptocurrency. The dots are flashing a green sign, currently aligned below the candlesticks.
The Awesome Oscillator is also glowing green and advocating for a positive price trend for Litecoin.
Lastly, the Klinger Oscillator made a bullish crossover in its last cut by the signal. At present, the indicator is travelling within the bull’s territory.
Conclusion:
In this technical analysis, all the indicators used have predicted a bullish run for the Litecoin market. The price trend is also speculated to see much volatility as advocated by the Bollinger Bands.


Article comments