Litecoin [LTC/USD] Technical Analysis: Red in the streets, bears have returned
![Litecoin [LTC/USD] Technical Analysis: Red in the streets, bears have returned](https://coinhub.news/img/6e/6e6271db2f095b254e0db5bc57de42cf_730_522.webp)
Litecoin [LTC] was like any other altcoin that faced yesterday’s bear wrath. It plunged to the depths to a low of $40, but the prices have gained some momentum and are on the path of correction. At the time of writing, LTC was trading at $41.99, with the market cap of $2.52 billion.
1-hour
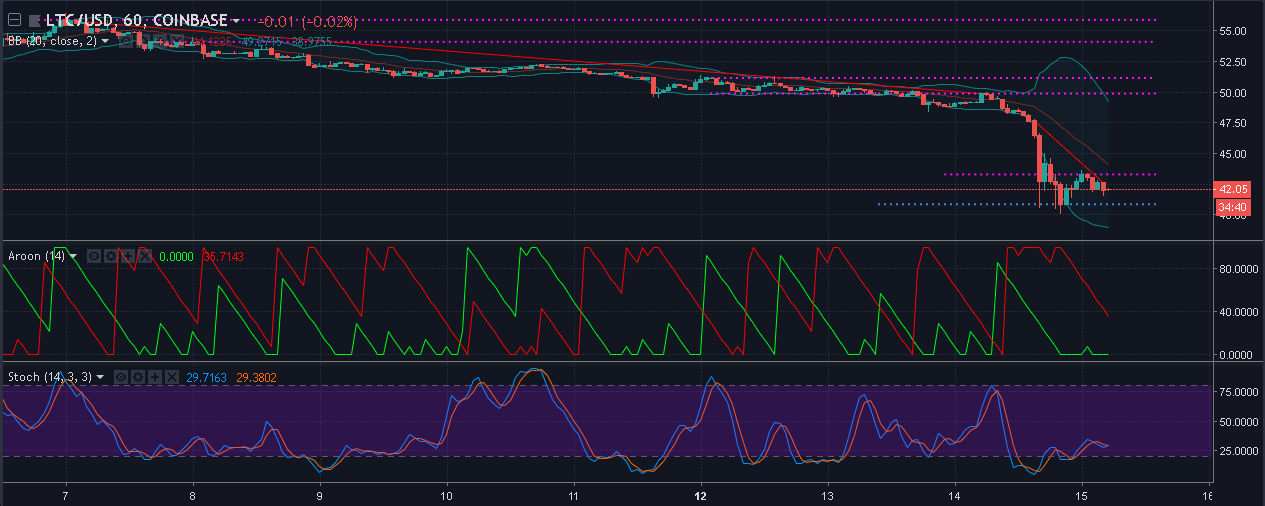
The plunge has caused Litecoin to break all its previously set supports, with no uptrends in sight. There is a downtrend that ranges from $55.69 to $49.87. There is a sharp plunge from there which has caused another downtrend $47.56 to $42.64.
The prices have broken supports at $48.84 and $48.17. New support is formed at $40.87. A new resistance is formed at $43.30. The next resistance points are at $49.88, $51.15, $54.09 and $55.88.
The Bollinger Bands are showing a huge expansion due to yesterday’s plunge, which indicates that the volatility has finally come back to the cryptocurrency market. The candles are below the simple moving average, indicating that the asset is oversold.
The Aroon indicator shows the Aroon downline has hit the 100 line and is moving to the zero line which indicates that the downtrend is slowly losing strength. While the Aroon up line has bottomed out indicating that the uptrend has extinguished.
The Stochastic is moving into the band after reaching an oversold position. The Stochastic line has undergone a bearish crossover.
1-day
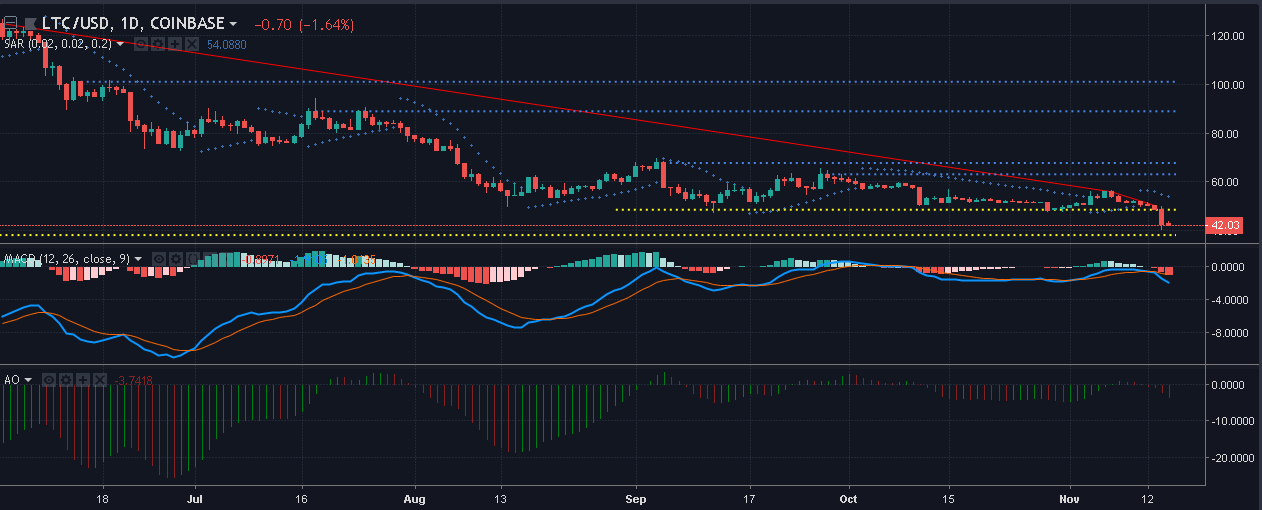
The one-day chart is showing the repurcussions of yesterday’s crash, with the downtrend ranging from $125 to $50.32 with a break at $55.88. LTC broke the support at $48.55 by plunging lower than last year’s prices. The support is formed at $38.14. The resistances are still the same [at $63.11, $67.75, $88.99 and $101.11] and holding steady.
The Parabolic SAR indicates a bearish move as the SAR markers are hanging over the price candles, pushing them further down.
The MACD indicator is showing a bearish crossover while the same is being indicated by the histogram.
The Awesome Oscillator shows the red spikes being formed below the zero line, indicating that the short-term momentum is falling faster than the long-term momentum which indicates a bearish opportunity.
Conclusion
The one-day chart, as indicated by the Bollinger Bands, Stochastic and Aroon indicators, show a strong bearish pressure in the market. The one-day chart as well shows the same bearish pressure over the market.


Article comments