Litecoin [LTC/USD] Technical Analysis: Prices tank faster than a crashing rocket
![Litecoin [LTC/USD] Technical Analysis: Prices tank faster than a crashing rocket](https://coinhub.news/img/f3/f3b9c91dc7c26e54a20c23da4ed62401_730_522.webp)
Litecoin, the silver to Bitcoin [BTC]’s gold seems to be competing with the other cryptocurrencies on its way down.
At press time, Litecoin [LTC] is trading at $31.53 and has seen a massive 25% fall in the past 7 days. The total market cap of Litecoin is $1.89 billion and the 24-hour trade volume is $504 million.
1 Hour
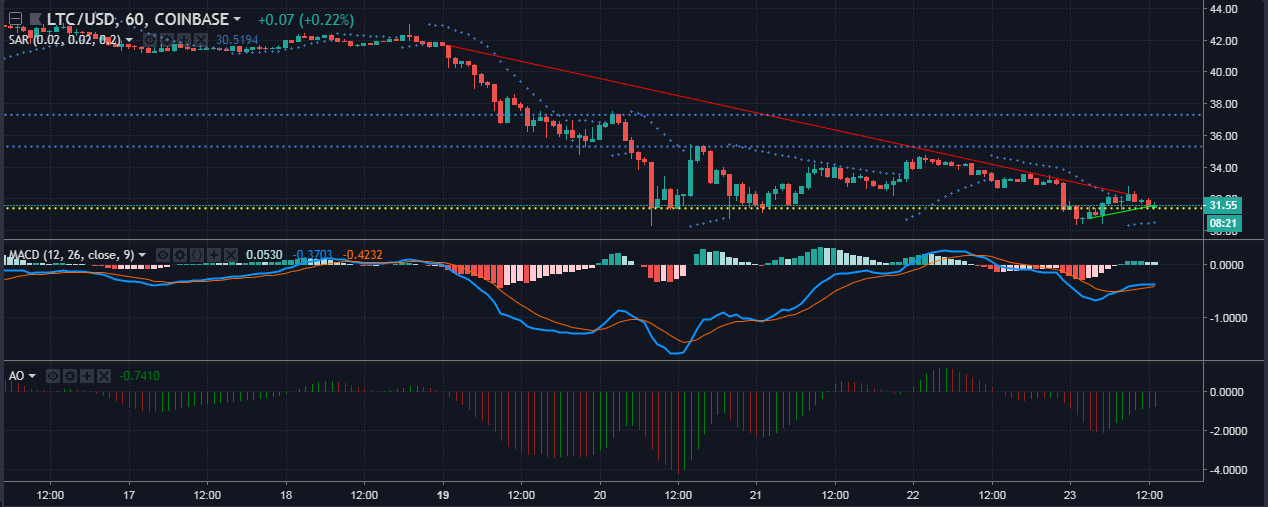
Litecoin has a short uptrend in the one-hour chart that extends from $30.77 to $31.58, while the downtrend extends from $41.66 to $32.29. The support at $$31.40 has been breached and the prices have dipped below briefly. The resistance points for Litecoin are at $35.29 and $37.29.
The Parabolic SAR markers are spawning below the candles indicating a short-term bullish pressure for Litecoin.
The MACD indicator shows a small bullish crossover that looks like it is about to be extinguished.
The Awesome Oscillator is showing that the short-term momentum is lower than the long-term momentum and green spikes have evolved from the red spikes.
1 Day
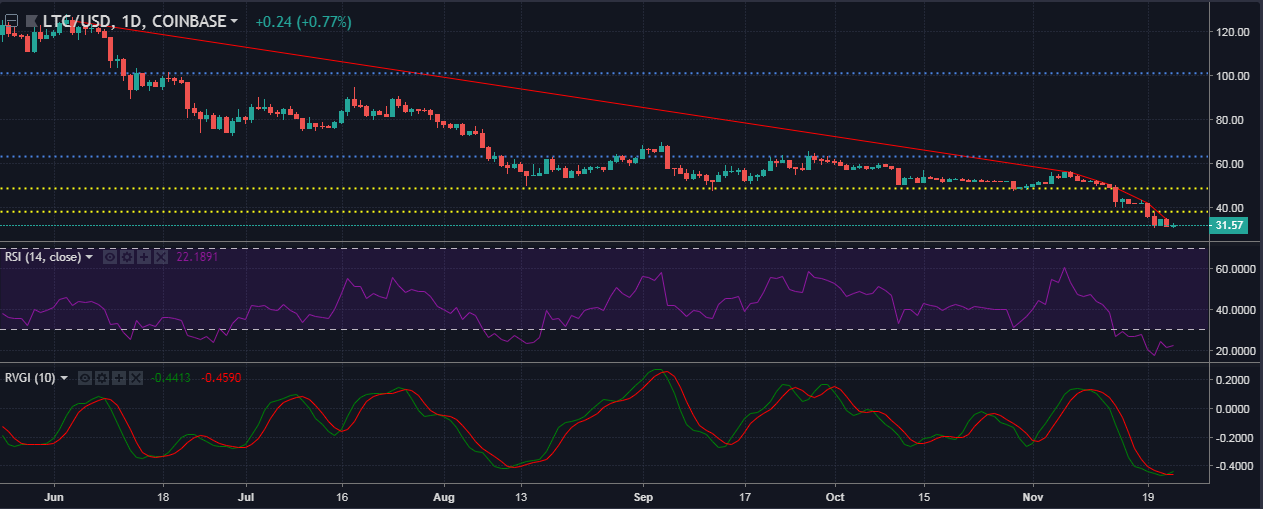
The downtrend in the one-day time frame for Litecoin ranges from $125 to $55.88. The support points at $48.55 and $37.93 have been breached as the prices have tanked amidst the bear market. The resistance points are at $63.11 and $101.11.
The Relative Strength Index has crossed 30 line and has hit rock bottom. The RSI now resides in the bear’s pit.
The Relative Vigour Index has undergone a bearish crossover and has come to the bottom where it has undergone a slight but an apparent bullish crossover.
Conclusion
The SAR indicates a bullish presence but MACD and AO indicate otherwise. The indicators in the one-hour charts are all bearish and have decided to make the bear’s pit their home.


Article comments