Litecoin [LTC/USD] Technical Analysis: Prices rise steadily as bulls try to escape sleeping bear
![Litecoin [LTC/USD] Technical Analysis: Prices rise steadily as bulls try to escape sleeping bear](https://coinhub.news/img/24/2499e01e94e6dc4c2c5d2c91e7e35feb_730_522.webp)
Litecoin [LTC] seems to be favoring a steady rise in prices, with the current price floating around $50.91. The token currently has a market cap of $3 billion, with a 24-hour trade volume of $363 million.
1-hour
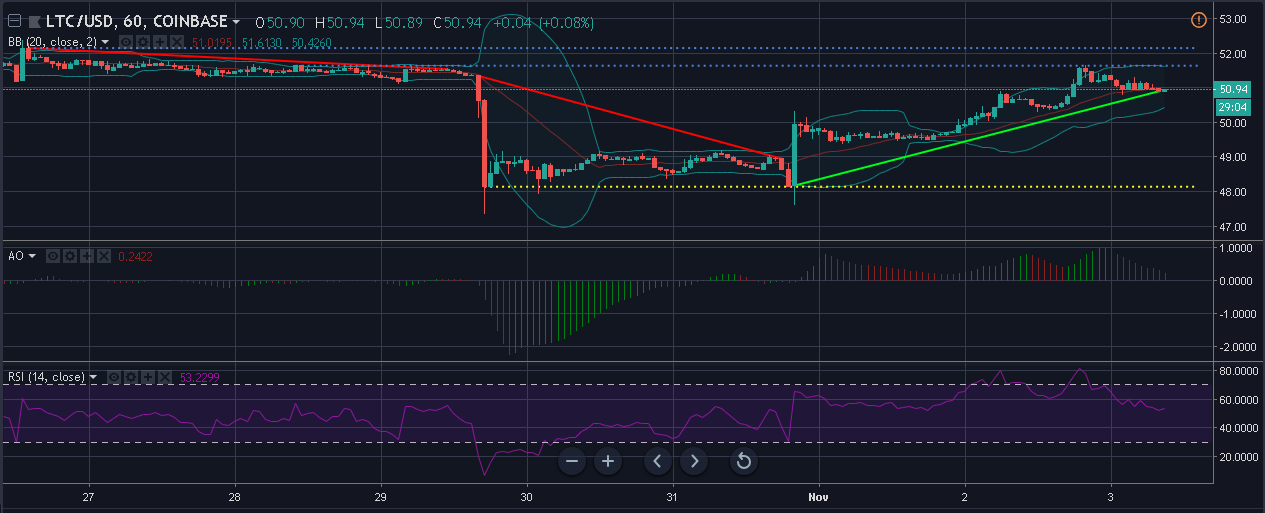
A downtrend is seen ranging from $52.15 to $48.95, while an uptrend can be seen after a very long time, ranging from $48.17 to $50.90. There was a huge spike in price on October 31 and there has been a steady growth ever since.
The price broke the recent slip-up that happened on October 29. The current support is seen at $48.14, with resistances set at $51.64 and $52.15.
The Bollinger bands seem to be undergoing a squeeze, with the bands leaning inwards. The price candles are starting to go below the exponential moving average [MA] after a brief run above the MA.
The Awesome Oscillator indicates brief periods of green spikes followed by red spikes, indicating a pivot in pressure from buyers to sellers.
The RSI indicator has seen a few overbought points and is slowly declining to the center, indicating that sellers are taking over slowly.
1-day
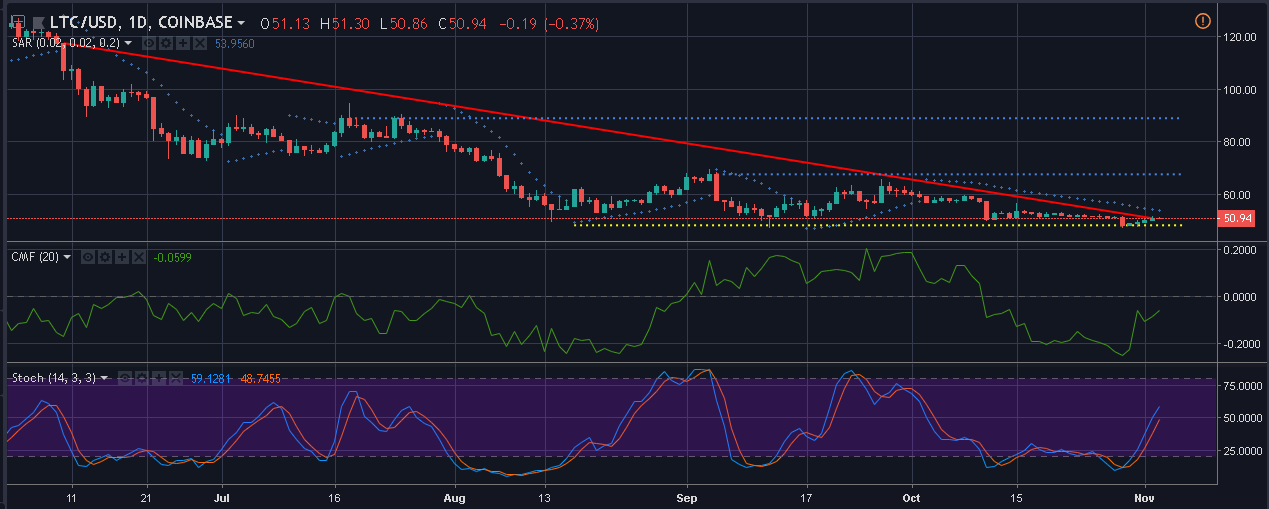
Unlike in the one-hour chart, the downtrend here is significant, spanning from $117.43 to $51.13, while no uptrend seems to be in sight. There is, however, a recent support formation at $48.44. The resistance is set up at $67.75 and $88.99.
The Parabolic SAR markers are seen hovering above the candles since October 2 and are converging towards it, but an overall bearish trend can be seen.
Chaikin Money Flow is all over the place. It is slowly rising above the axis, indicating that the money is flowing into the market and that buying pressure is increasing.
The Stochastic line has crossed over the signal line and is mooning to the top, indicating a bullish move.
Conclusion
The one-hour chart indicates an overall bearish move with Bollinger Bands having a rather neutral stance. The one-day chart seems bearish in the big picture, except for the Stochastic indicator.


Article comments