Litecoin [LTC/USD] Technical Analysis: Momentary take over by the bulls hasn’t fazed the bears
![Litecoin [LTC/USD] Technical Analysis: Momentary take over by the bulls hasn’t fazed the bears](https://coinhub.news/img/1f/1f8919e16504dc45bc4b0e41a264af99_730_522.webp)
Litecoin [LTC] has faced a few hardships as it was overtaken by Bitcoin SV and pushed to the ninth rank by the bearish market. However, Litecoin’s ninth spot was temporary, as it did recover and is now holding steady as the seventh-largest cryptocurrency in the world.
Litecoin, at the time of writing, was trading at $34.32 with a 24-hour change of 4% in the green side. The market cap is holding above the $2 billion line.
1-hour
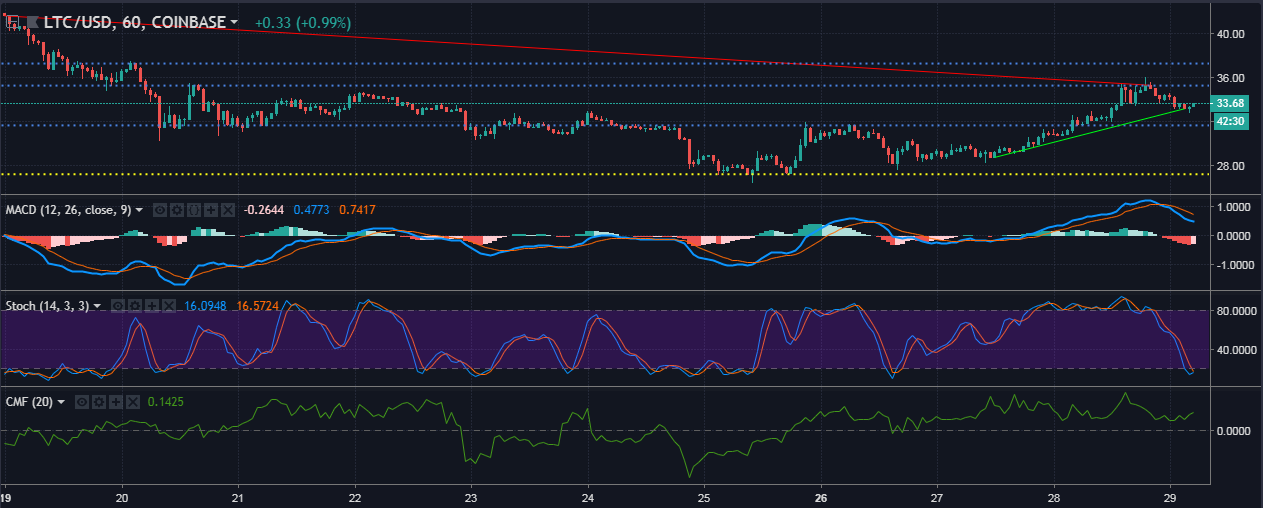
Litecoin, from the one-hour chart, shows a downtrend that extends from $41.62 to $35.32 and an uptrend that ranges from $28.78 to $33.18. The prices for Litecoin have broken resistance at $31.68 and have touched the next immediate resistance at $35.29. The support at $27.25 is holding strong as the prices have started an upswing trend since November 27.
The MACD indicator is undergoing a bearish crossover as the prices have started dipping. The histogram for MACD shows red bars hanging below the zero-line.
The Stochastic indicator has burned out the bearish crossover as it is below the 30-line.
The Chaikin Money Flow is slightly above the zero-line, which shows that the buyers are still in control of the Litecoin market.
1-day
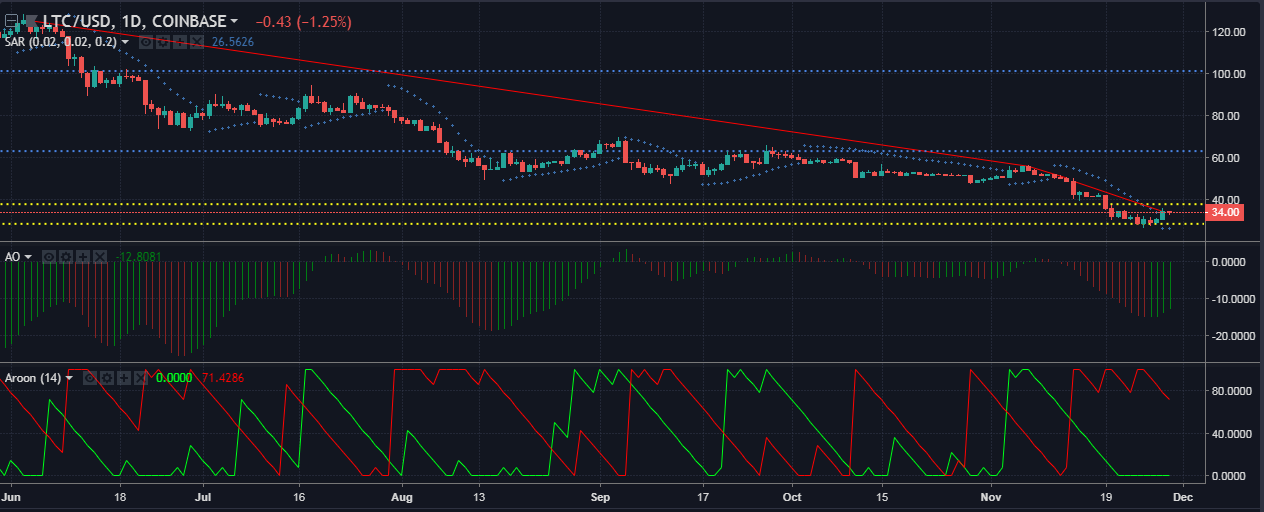
The one-day chart for Litecoin shows a small rise, with an uptrend yet to form. The downtrend, however, extends from $125 to $34.43. Litecoin has breached support at $37.39 and set up a new low for support at $28.26. The resistance points at $63.11 and $101.11 seem too far for the prices to breach them, which is highly unlikely in the current bear market.
The Parabolic SAR markers seem surprisingly bullish as they’ve spawned below the price candles, which represents a bullish trend, no matter how small.
The Awesome Oscillator shows a bearish crossover to the bottom, but also a transition of green lines into red lines. The overall take on AO indicator is that the short-term momentum is falling faster than the long-term momentum.
The Aroon indicator shows a clear dominance of the downtrend and exhaustion of the uptrend for Litecoin.
Conclusion
The MACD and Stochastic indicators show a bearish outlook for Litecoin, while the CMF is still riding with the bulls. The SAR is the only bullish indicator in the one-day chart show, while Aroon and AO show a bearish presence.


Article comments