Litecoin [LTC/USD] Technical Analysis: Christmas rally seems to have made a splash on daily charts
![Litecoin [LTC/USD] Technical Analysis: Christmas rally seems to have made a splash on daily charts](https://coinhub.news/img/1c/1c64b7ff85c060d18e3cddee84e44bff_730_522.webp)
Litecoin took over Bitcoin Cash in a frenzy recently but has now decided to come back down and become the eighth-largest cryptocurrency as per the data from CoinMarketCap.
Litecoin is currently being traded at $32.32, with a market cap of $1.92 billion. The 24-hour trade volume is holding at $587 million.
1-hour
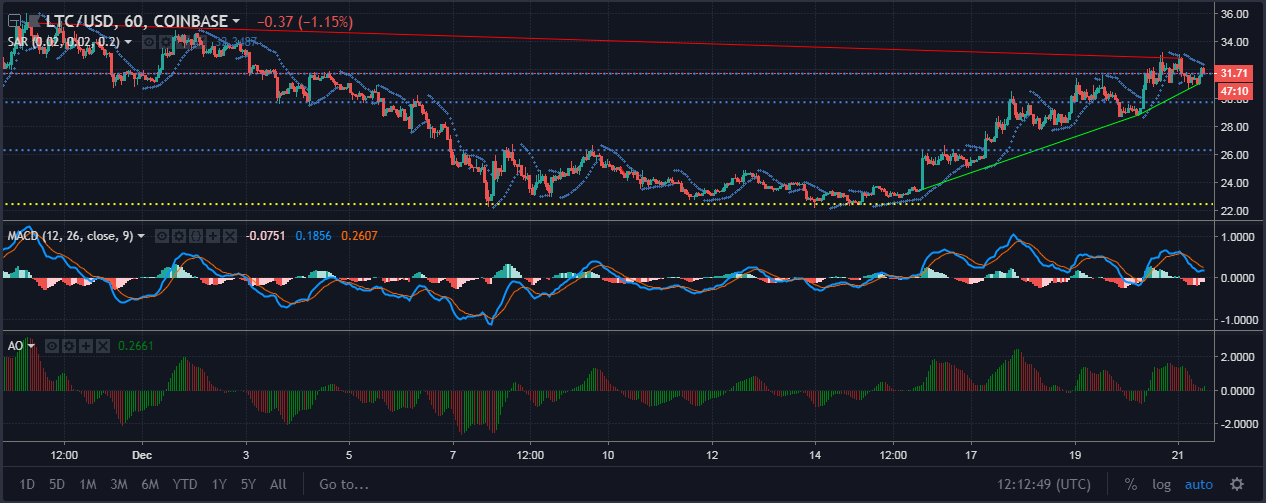
The uptrend for Litecoin in the one-hour time frame extends from $23.54 to $31.03, while the downtrend has exhausted as a result of the recent rally, and extends from $35.32 to $32.82. Litecoin prices have drifted away from the support at $22.49 in an upward direction towards the resistance at $26.31, $29.70 and $31.77. The resistance at $31.77 is being tested.
The Parabolic SAR markers have spawned above the price candles which indicates a bearish pressure to the prices.
The MACD indicator is showing a massive bearish crossover for Litecoin prices indicating that the short rally has come to an end.
The Awesome Oscillator shows receding spike above the zero-line, indicating a probability of an imminent bearish crossover.
1-day
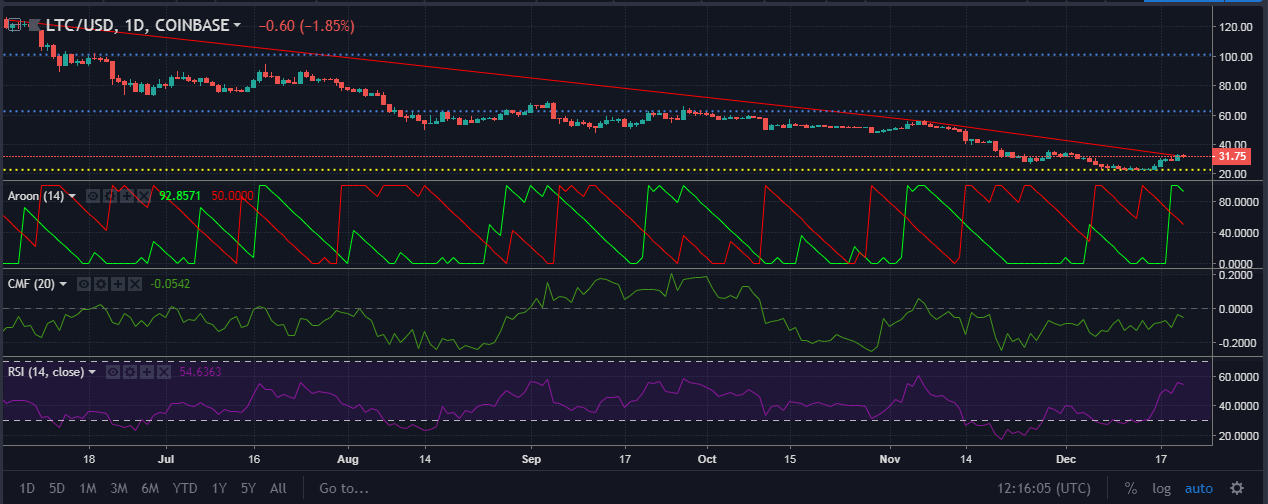
The one-hour chart looks the same as the downtrend extends from $125 to $32.36, with no uptrend yet to be formed in the larger time-frame.
The support for Litecoin in the one-day time frame is seen holding strongly at $22.84, while the resistance lines at $62.63, $101.11 are yet to be tested.
The Aroon indicator shows a full-fledged uptrend underway as the Aroon up-line has hit the 100-line, while the Aroon downline has exhausted and sunk to the bottom.
The Chaikin Money Flow is under recovery from the oversold zone due to the short-term rally, which indicates that the money is flowing into the market.
The Relative Strength Index shows a recovery as well, as it has risen above the 50-line indicating that the buy-momentum is increasing in the Litecoin market.
Conclusion
The one-hour chart shows that the bulls have run out of juice as indicated by the SAR, MACD and AO indicators. The one-day chart shows more promise than the one-hour chart as it is bullish which is indicated by Aroon, CMF, and RSI.


Article comments