Litecoin [LTC/USD] Technical Analysis: Bull takes a short term lead but bear seems to win the race
![Litecoin [LTC/USD] Technical Analysis: Bull takes a short term lead but bear seems to win the race](https://coinhub.news/img/d8/d820e781f6cdeccc0fa5f6be3bf425d0_730_522.webp)
Litecoin [LTC], the ninth-biggest cryptocurrency by market cap, continues to take the bear’s blows. Nonetheless, the coin showed signs of resistance as it successfully landed attacks on the bear, earlier this week.
According to CoinMarketCap, at press time, Litecoin was trading at $29.73 with a market cap of 1.76 billion. The coin has a trading volume of $538.04 and has witnessed a significant downfall of 12.24% in the past seven days.
One-hour
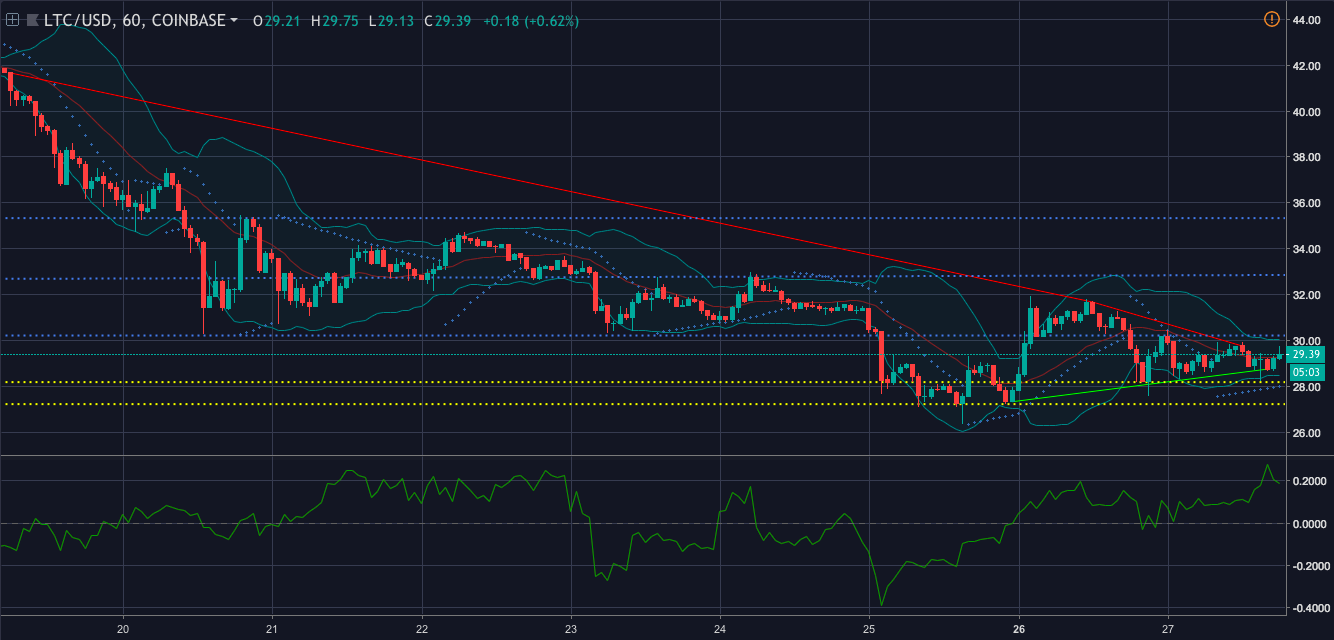
Chaikin Money Flow is currently showing a bullish wave as the line is above the zero line, demonstrating that the money is flowing into the market.
Parabolic SAR is also on the bull’s side of the market as the dots have aligned below the candlesticks with an aim to push the coin upwards.
Bollinger Bands are forecasting a less volatile market as the bands have started to contract for the coin in the market.
One-day
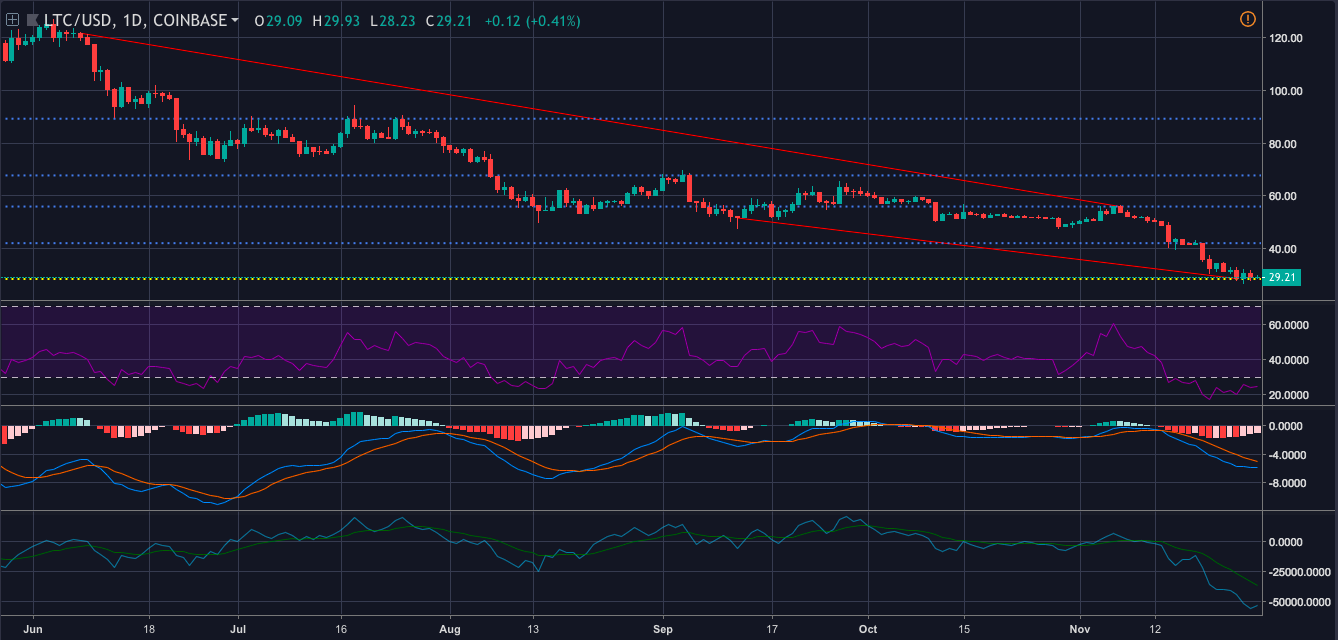
RSI is showing a bearish trend as the selling pressure for the coin is more than the buying pressure.
MACD is picturing the coin in the bear’s shelter as the moving average line has made a bearish crossover.
Klinger Oscillator is on the same line as the MACD as the reading line has made a bearish crossover.
Conclusion:
The bull has gained the support of Parabolic SAR and CMF from the one-hour chart. However, the bear is still a winner in the long-term as it has gained the support of RSI, MACD, and Klinger Oscillator from the one-day chart.


Article comments