Litecoin [LTC/USD] Technical Analysis: Bull stampede has bears searching for cover
![Litecoin [LTC/USD] Technical Analysis: Bull stampede has bears searching for cover](https://coinhub.news/img/b7/b7e92d4b36af58b6fdfe75a1b3a5c988_730_522.webp)
Litecoin, in the long-term, has been tanking consistently, but there seems to be a slow uptrend emerging, with the current price at $53.06. The market cap of Litecoin can be seen hovering at $3.1 billion, with a 4.2% increase in its price over the past 24 hours.
1-hour
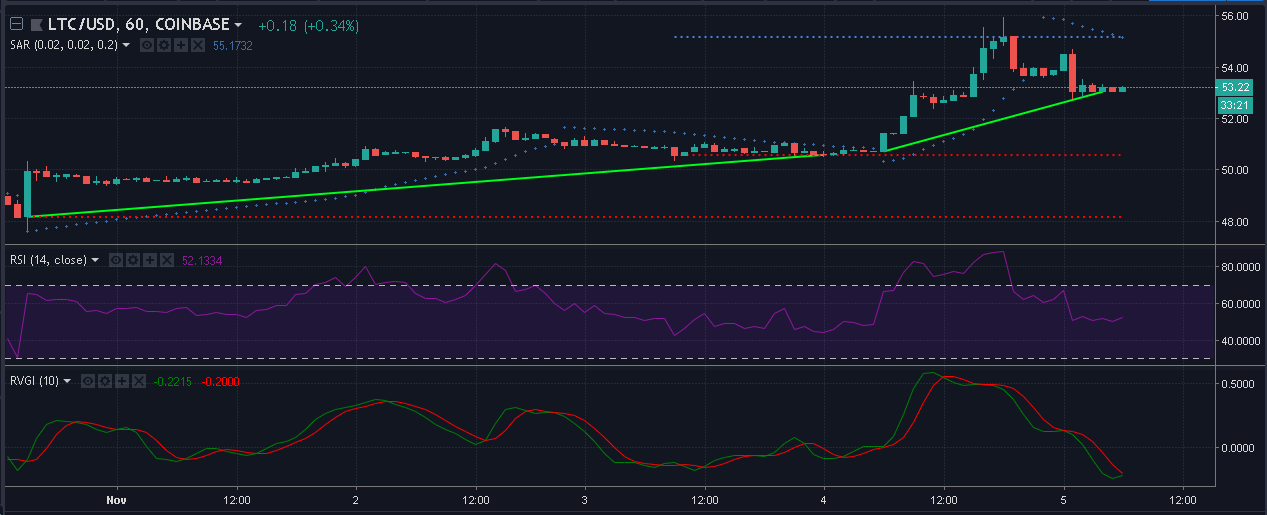
The one-hour chart shows a bullish uptrend ranging from $48.17 to $53.05, with supports set up at $50.58 and $48.17. The resistance was set up on November 4 at $55.18.
The Parabolic SAR markers are seen on top of the candles, indicating a bearish pressure in the market.
The RSI indicator has topped over the last day, indicating an oversold mark. The prices have decreased and so has the RSI, with an equal pressure of buyers and sellers in the market.
The RVGI line is tumbling and is about to cross the signal line over to the top, indicating a saturation in sell pressure and a bullish move, if it completes the crossover.
1-day
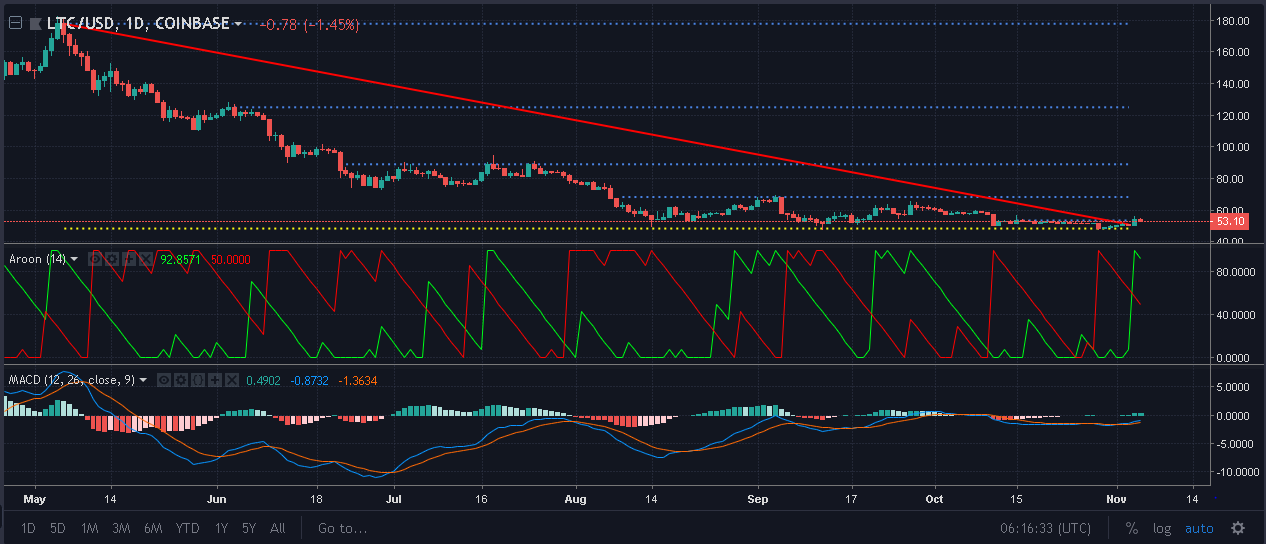
A clear and distinct downtrend is seen spanning in the $177.74 to $51.13. The support for Litecoin can be seen at $48.45, which was set up on October 29, with two short-term resistances set up at $53.55 and $68.35. Long-term resistances are set up at $89.02 and $125. The price has crossed the initial $53.55 resistance point and has moved up.
The Bollinger Bands are converging, indicating a reduction in volatility. However, the prices have crossed the top band, indicating an overbought market.
The MACD indicator line is crossing over the signal line to the top, indicating a bullish crossover, which is also represented by the MACD histogram.
The Aroon downline has saturated as it hit the top on October 29, indicating a decrease in the dominance of the downtrend. In the meantime, Aroon upline has gained more power, indicating a bullish trend.
Conclusion
In the one-hour chart, Parabolic SAR shows a bearish market, while the RSI indicator is neutral with a crossover yet to happen on RVGI. The Bollinger bands, MACD and Aroon indicator show a bullish trend.


Article comments