Litecoin [LTC/USD] Technical Analysis: Bear still has control over the crypto market
![Litecoin [LTC/USD] Technical Analysis: Bear still has control over the crypto market](https://coinhub.news/img/56/563bc656e8d4f712468846216c4b38c8_730_522.webp)
Litecoin [LTC] has had the sideways momentum like other altcoins in the on-going bear market. The bear’s clasp on the cryptocurrency hasn’t relaxed since the start of 2018. The community, however, is optimistic about Litecoin’s developments with its recent, Core 0.17 update news that will supposedly reduce the transaction costs by 10x.
1-hour
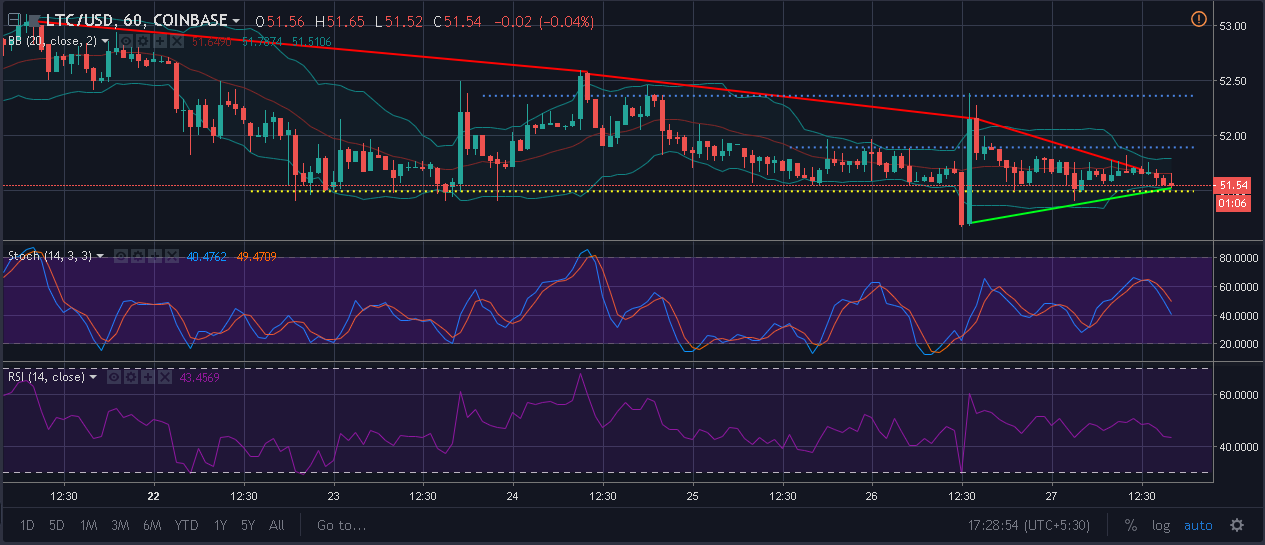
Support can be seen at $51.49, that was set on October 23, and there are two successive resistance points set at price points $52.36 and at $51.89.
The candles in the 1-hour chart are below the exponential moving average, indicating a bear movement. The Bollinger Bands, however, are close to each other indicating the decrease in volatility.
The Stochastic indicator has clearly crossed the signal line towards the bottom, indicating a bearish crossover.
The RSI has been at the centre for quite a while indicating the mark momentum between sell and buy is balanced.
1-day
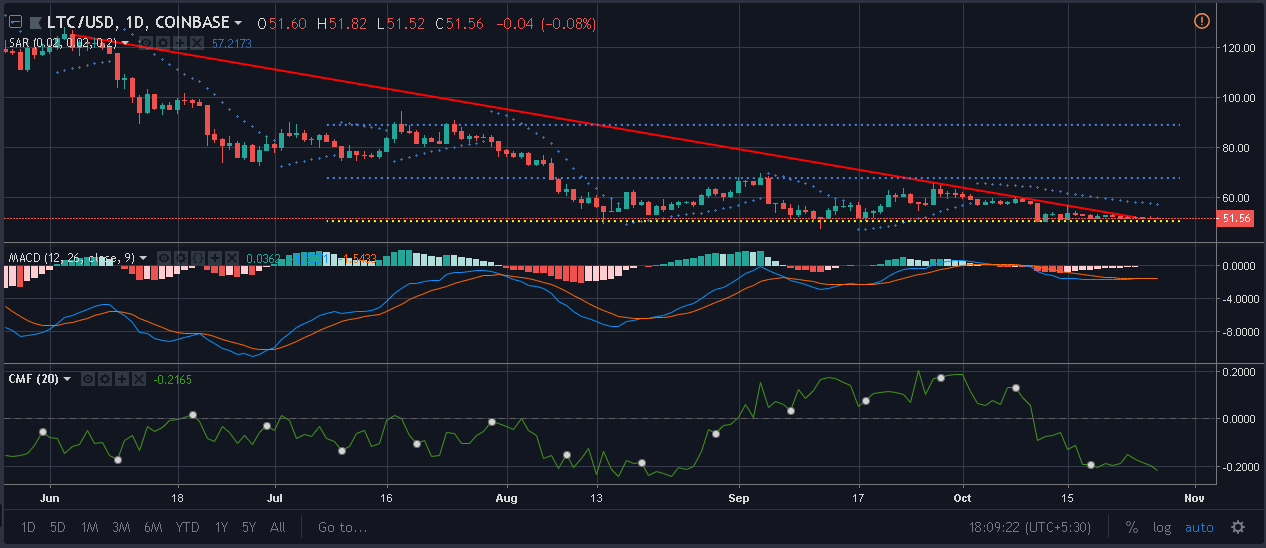
Parabolic SAR markers are above the candles indicating a bearish pressure.
MACD line is extremely close to the signal line indicating a possible crossover to the upside.
Chaikin Money Flow indicator is going below the zero line indicating money is going out of the market which is a bearish sign.
Conclusion
In the 1-hour chart, the Bollinger bands, as well as the Stochastic lines, indicate a bearish move of the market, while the RSI indicator is at the centre indicating even buy and sell pressure. The Chaikin Money Flow indicator and Parabolic SAR, both indicate a bearish move, while the MACD is slightly bullish.


Article comments