Litecoin [LTC/USD] Technical Analysis: Bear and bull to engage in battle spewing volatility
![Litecoin [LTC/USD] Technical Analysis: Bear and bull to engage in battle spewing volatility](https://coinhub.news/img/38/38369c9c9de93efd23b72a2a2589ed10_730_522.webp)
The cryptocurrency market is undergoing a phase of volatility wherein all the coins across the board have taken to an unpredictable behavior. Here, LTC is currently down by 4.62%. At press time, the coin was trading at a depreciated price of $30.3 with a market cap of $1.8 billion. The 24-hour trading volume was recorded at $385.4 million.
1-hour

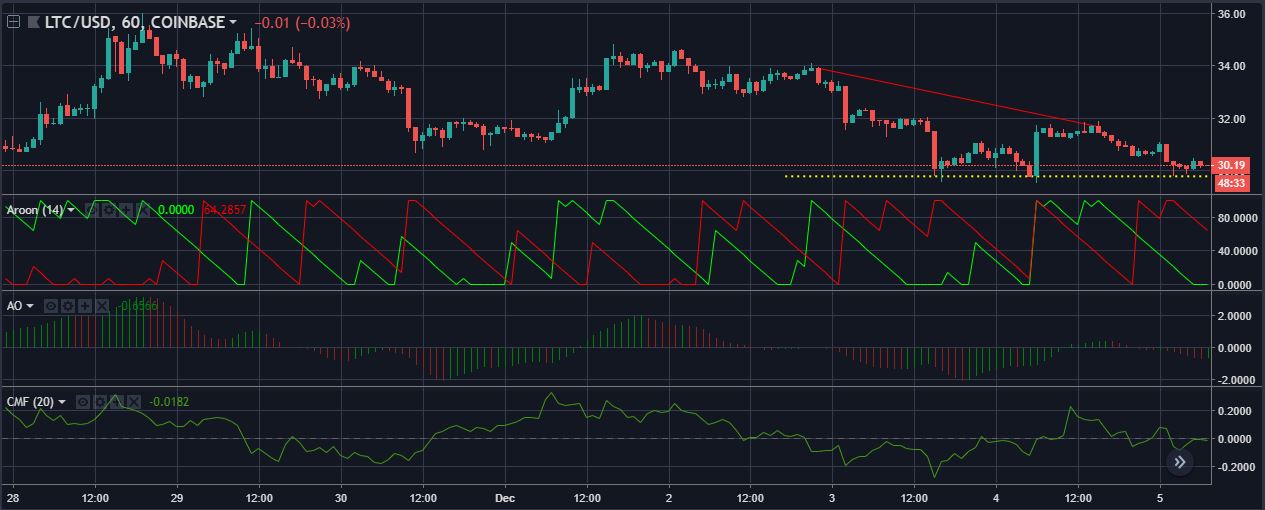
In the one-hour analysis, a steep downtrend has been observed that extends from $33.9 to $31.6. Here, the support levels were violated several times, wherein the support is currently holding the price above $29.7. However, the possibility of a trend breakout is meek as the market is already volatile enough to avoid price concentration.
The Aroon Indicator is depicting an extremely weakened uptrend for the LTC market. Though a relatively stronger downtrend, it is also slumping on the indicator board. However, the indicator is currently more bearish than bullish.
The Awesome Oscillator has just turned green in color, hence, siding the bull after a bear-run.
The Chaikin Money Flow is going against the above indicator to approve of the Aroon indicator’s prediction. The reading line is below the 0-line as the indicator has begun to move downwards again, hence, signaling a bearish presence in the Litecoin market.
1-day

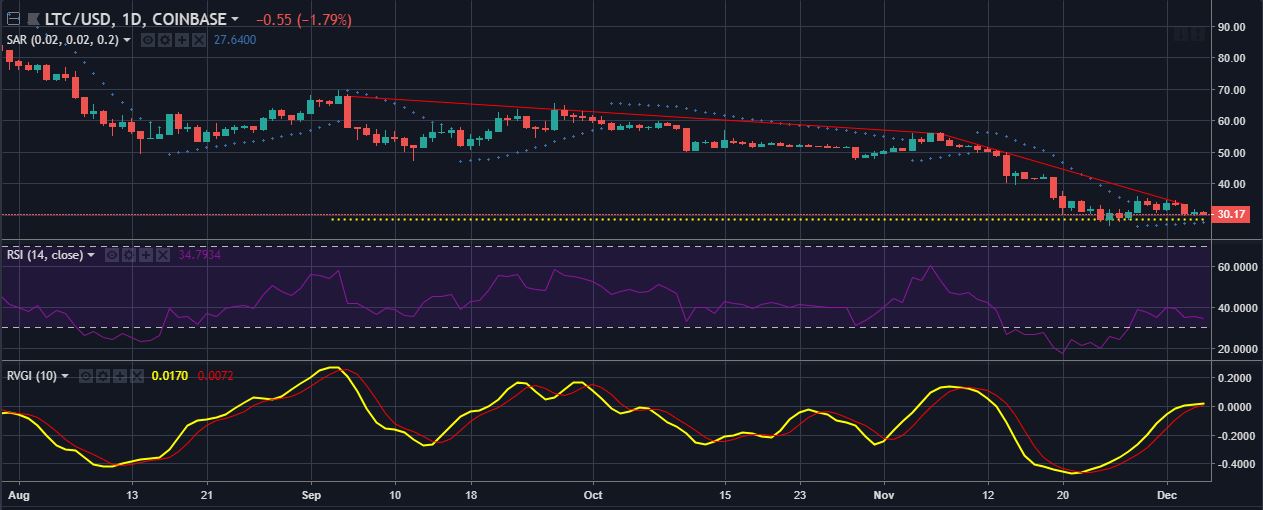
In a longer timeline, two downtrends can be observed, one moving from $67.7 to $55.9 and another from $55.9 to $33.4. Meanwhile, the support is set at $28.9. The immediate downtrend is forming a descending triangle with the support line to depict a deep bearish run in the LTC market.
The Parabolic SAR is bullish on the price trend of the coin as the dots are floating beneath the candlesticks to provide support.
However, the RSI is bearish on the cryptocurrency. Between November and December, LTC hit the oversold zone but is back up to only indicate a bear-run for the market.
The Relative Vigor Index is bullish on the coin as the RVGI is showing a bullish crossover at present. However, this stance cannot be confirmed as the indicator is showing signs of making a bearish crossover after making contact with the signal.
Conclusion
As can be seen in this technical analysis, the indicators are showing a mixed response to LTC market speculation. However, much volatility can be predicted in the market as the chart does not show much concentration in the trading prices.


Article comments