Litecoin [LTC] Technical Analysis: The cryptocurrency tumbles down to hit its yearly low
![Litecoin [LTC] Technical Analysis: The cryptocurrency tumbles down to hit its yearly low](https://coinhub.news/img/8c/8c63e2ddc5256a22943fbac41b2169d1_730_522.webp)
On 19th November, the cryptocurrency community witnessed another major downfall of the market when Bitcoin [BTC] fell below the $5000 mark. Along with BTC, the value of other cryptocurrencies also declined significantly.
At the time of writing Litecoin [LTC] is trading at $36.93 with a market cap of $2.1 billion. The cryptocurrency has declined by 13.98% in the past 24 hours. Also, in the 7 hours statistics, the coin shows a significant drop of 28% approximately.
1 hour:
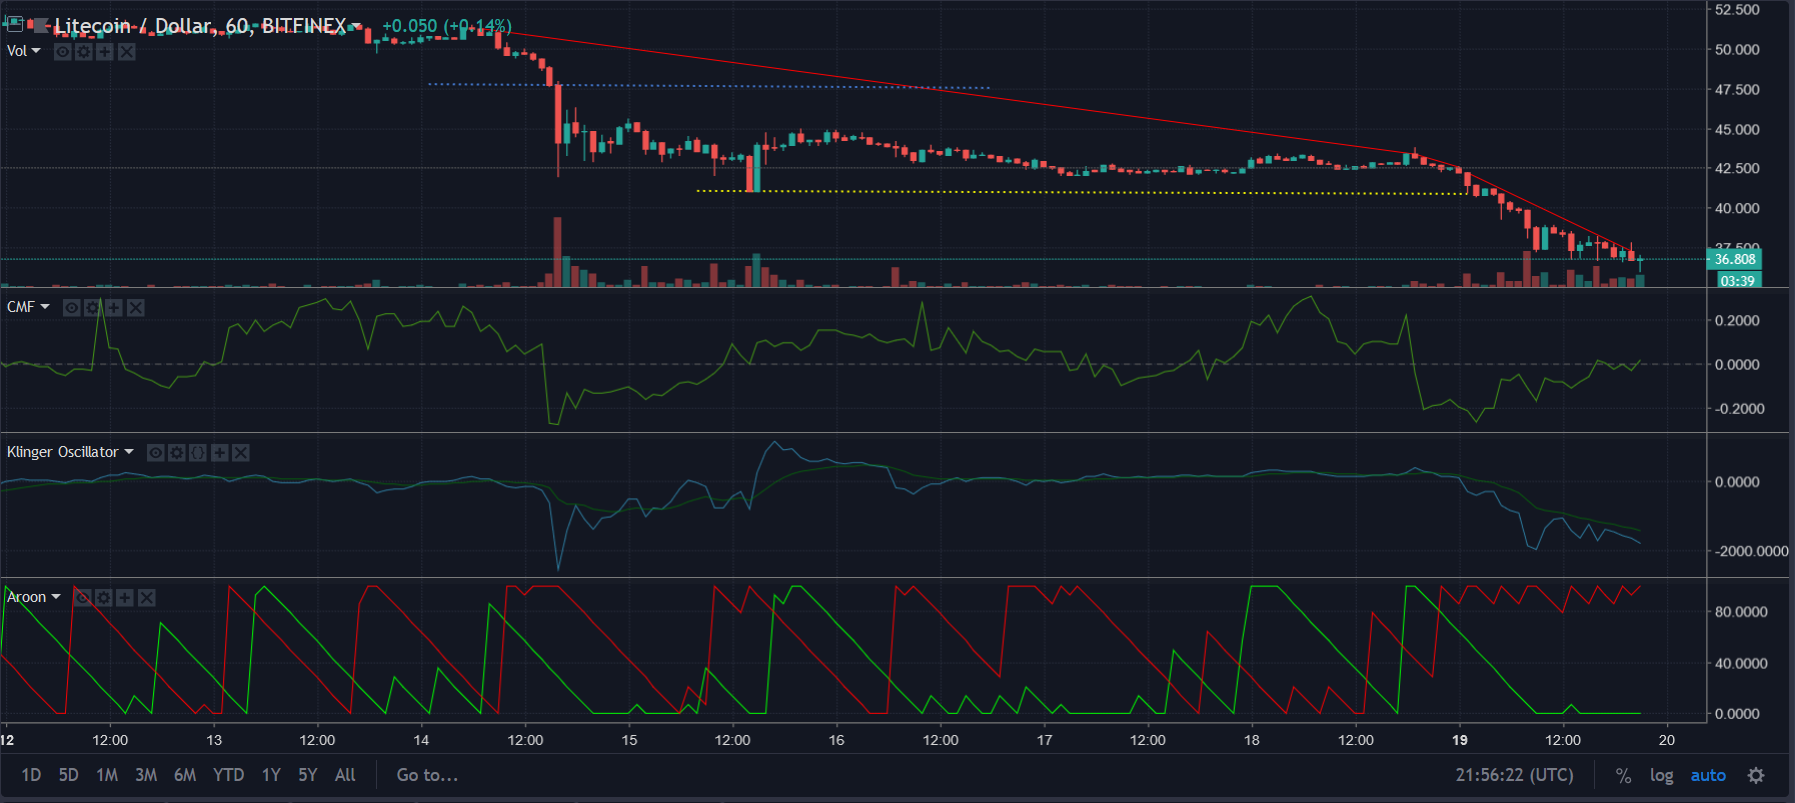
The 1-hour chart of Litecoin [LTC] clearly shows that the price has dropped rapidly in this time frame. There is a downtrend ranging from $51.35 – $43.29 – $37.3 with a resistance point set at $47.58. The cryptocurrency has broken the support level f $41.2 and has further shown a downward correction and reached the current point.
The Chaikin Money Flow [CMF] is currently trying to gain back its position above the zero line depicting that the inflow of money in the LTC market is very less.
The Klinger Oscillator has taken a bearish crossover with both the reading line and the signal line moving downwards.
The Aroon indicator shows that the bears have overtaken the LTC market at the moment. The Aroon Up line has reached the zero line and continues to move sideways without any sign of a reverse trend. Also, the Aroon Down line has touched the maximum point with a sideways progress.
24-hours:
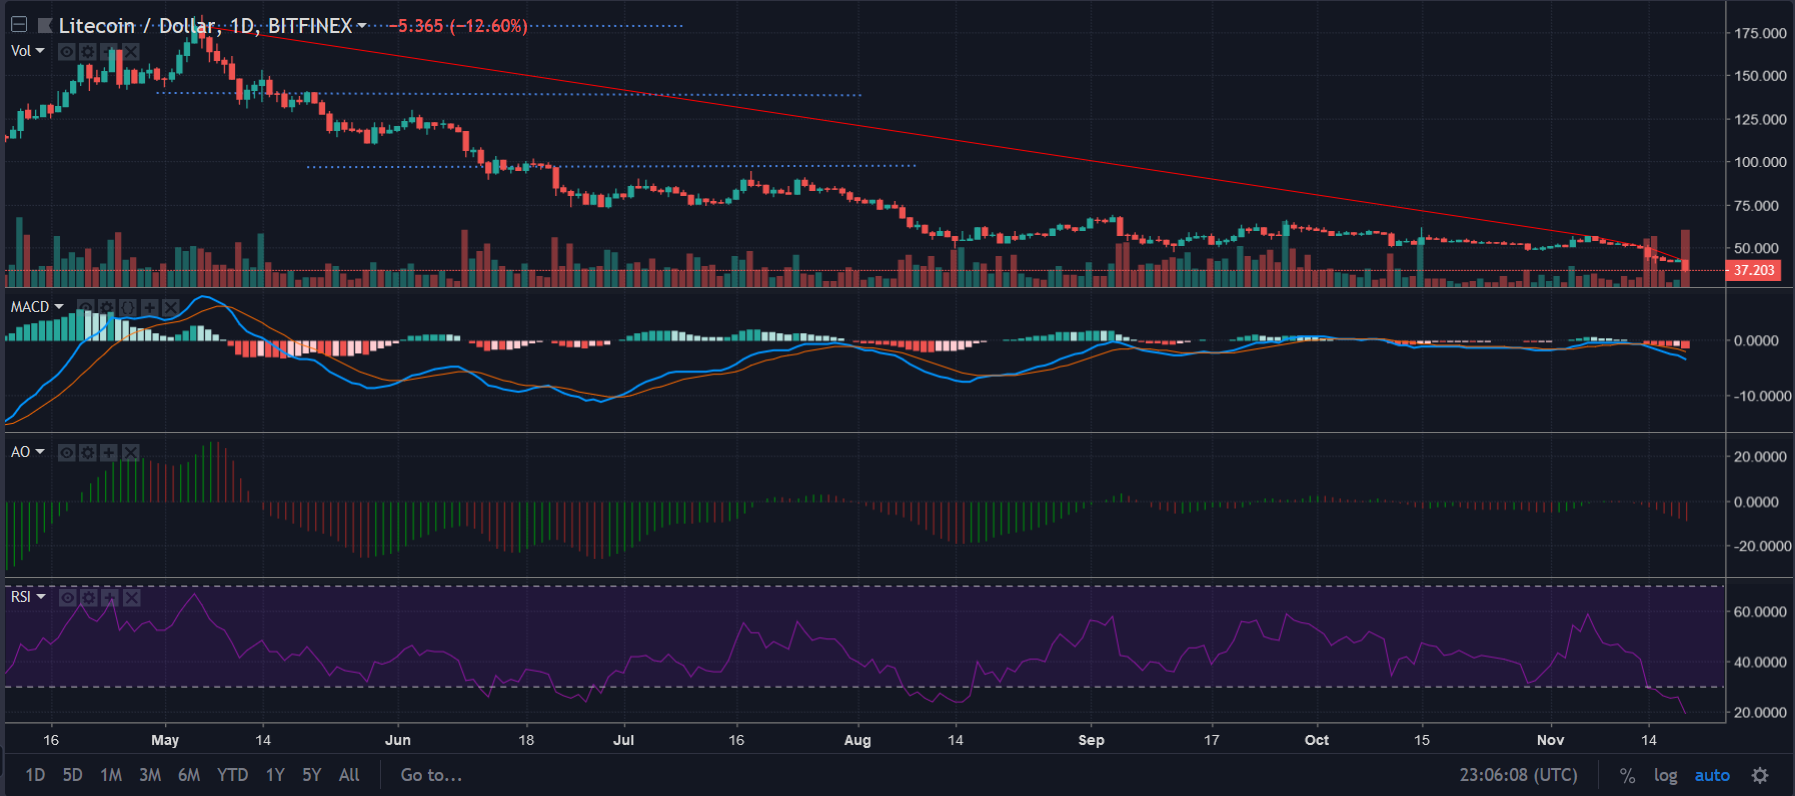
The 1-day chart of LTC shows a downtrend ranging from $179.8 – $50.6 – $42.58. The resistance points are set at $179.8, $140.5 and $97.6.
The MACD is showing a bearish crossover with the moving average line continuing a downward journey. The histogram has started to form negative bars indicating a strong bearish trend.
The Awesome Oscillator is forming a red signal suggesting that the downtrend will continue in the future.
The Relative Strength Index [RSI] has crossed the oversold line and moving further downwards indicating that the selling pressure is much higher than the buying pressure.
Conclusion:
The above Technical Analysis illustrates that the price of LTC is highly on the bearish end. All the indicators in both the timeframes strongly support a negative price movement of the cryptocurrency.


Article comments