Litecoin [LTC] Technical Analysis: Bulls and bears brawl to take control of token
![Litecoin [LTC] Technical Analysis: Bulls and bears brawl to take control of token](https://coinhub.news/img/2a/2a84f95d7d225d20b4bd87d105d48289_730_522.webp)
Litecoin [LTC], the seventh-largest cryptocurrency, is showing an increase of 7.40% in its prices in a 24-hour time frame. It is currently trading at $31.20, with a market cap of $1.85 billion [at the time of writing].
The trading volume of Litecoin is $535 million, of which 16%, i.e., $97 million, came from DOBI Trade exchange with trading pair LTC/BTC.
1-hour
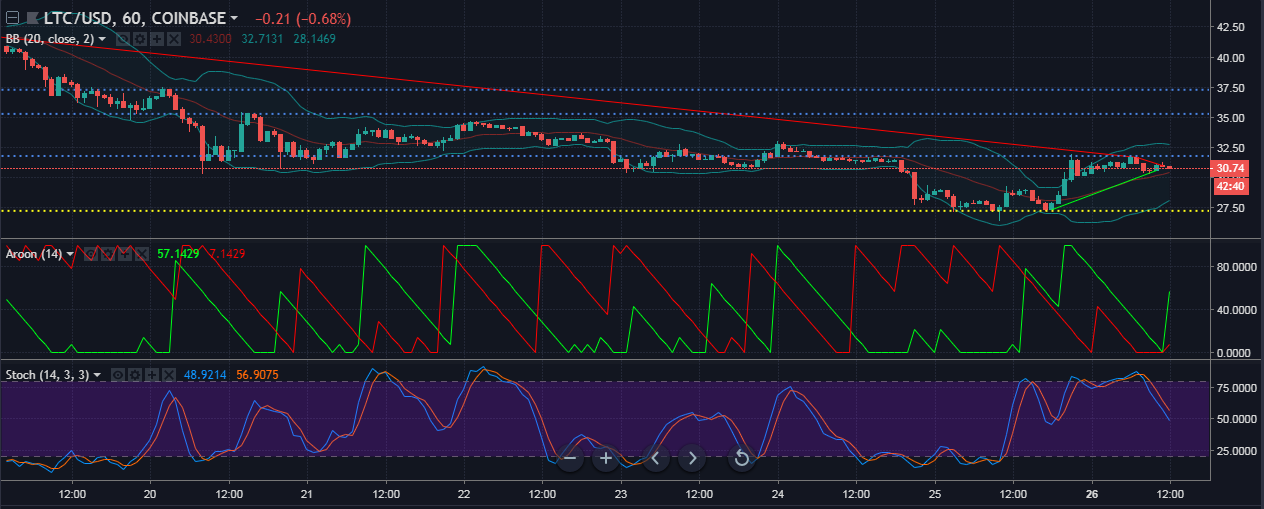
The one-hour chart for Litecoin shows an uptrend extending from $27.34 to $30.59, while the massive downtrend extends from $41.66 to $30.99 is also prevalent. The support at $31.40 has been breached by the prices on November 25. Litecoin has created a new support at $27.25, while resistances are set up at $31.80, $35.29, and $37.29.
The Bollinger Bands are in an expansion as volatility has kicked in on November 25, at 19:00 UTC. The prices have consistently been above the simple moving average, which indicates a bullish presence.
The Aroon indicator shows both the downtrend and the uptrend hitting the bottoms. Only the Aroon up line has sprung up and is currently at 50, indicating an incoming uptrend.
The Stochastic indicator shows a bearish crossover to the bottom.
1-day
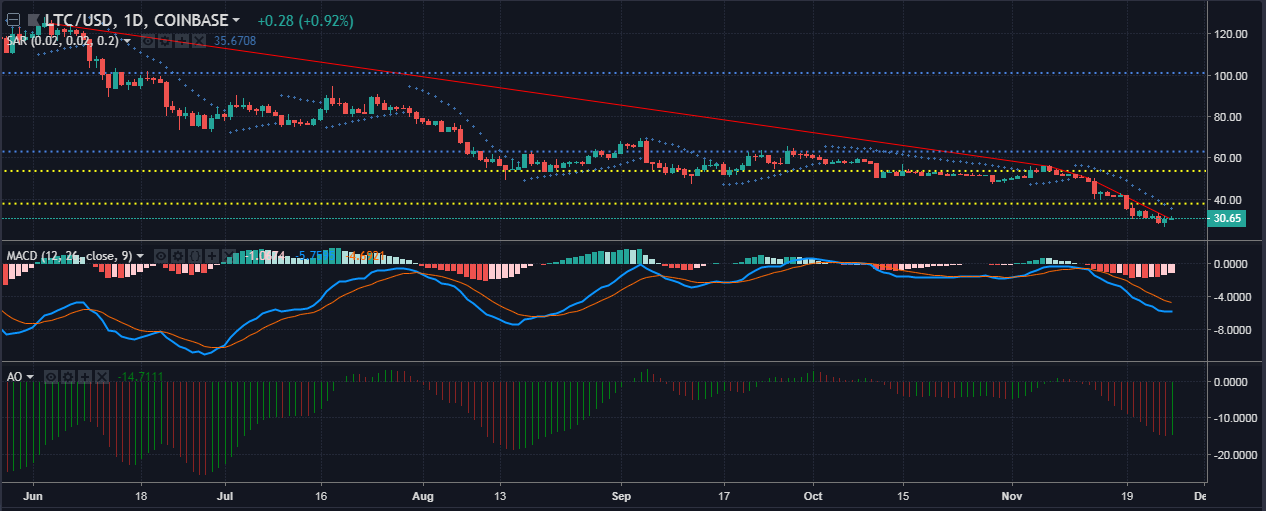
The downtrend for one-day chart ranges from $125 to $30.37, with no uptrend in sight. The supports at $53.73 and $37.93 have been broken as the prices dipped to new lows. Resistance points for Litecoin can be visualized at $63.11 and $101.11.
The Parabolic SAR markers are seen above the price candles of Litecoin, indicating a bearish presence in the market.
The MACD is seen showing a bearish presence as well with the bearish crossovers seen clearly.
The Awesome Oscillator shows a subsequent increase in the red spikes, which means that the prices are dropping continuously. However, the tides are shifting in favor of the bull.
Conclusion
The Bollinger and Aroon show a creeping bullish trend while the Stochastic indicator shows otherwise. The SAR, AO, and MACD are all showing bearish crossovers.


Article comments