Ethereum [ETH/USD] Technical Analysis: The bull-bear getaway leaves the market inactive
![Ethereum [ETH/USD] Technical Analysis: The bull-bear getaway leaves the market inactive](https://coinhub.news/img/51/5142c0fd263cbd064904bbdcd06973eb_730_522.webp)
Ethereum [ETH], the second largest cryptocurrency in the world, has dominated the blockchain industry by remaining the leading choice of platform for dApps and other new projects. However, the cryptocurrency market has been playing a sideways game of late, wherein Ethereum has also succumbed to the weak price trends across the board.
At the time of writing, Ether had dropped by 0.5% in the market and was trading at $204.24, with a market cap of over $20.9 billion. Its 24-hour trading volume was recorded at $1.23 billion.
1-hour:
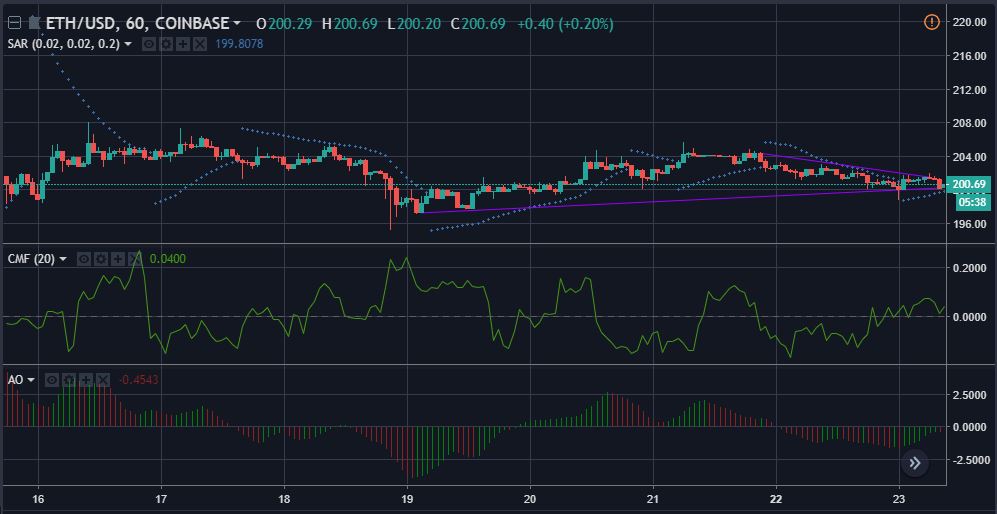
In the given time-frame, the two trend lines from $204.3 to $201.5 [downtrend] and $197.2 to $200.21 [uptrend] are likely to converge sometime soon. However, a trend breakout is yet to occur and might take a while as the prices still have moving space within the gap.
The Parabolic SAR is evidently bullish on the ETH market. The dots are displaying full support to the candlesticks.
The Chaikin Money Flow indicator is also positive about the fate of the coin as the reading line is swimming above the 0-mark. The indicator is approaching an upward trend, confirming its stance on the Ether market.
Meanwhile, Awesome Oscillator disagrees with the above indicators and has turned its red lights on. At present, it is flashing a warning against the ETH price trend.
1-day:
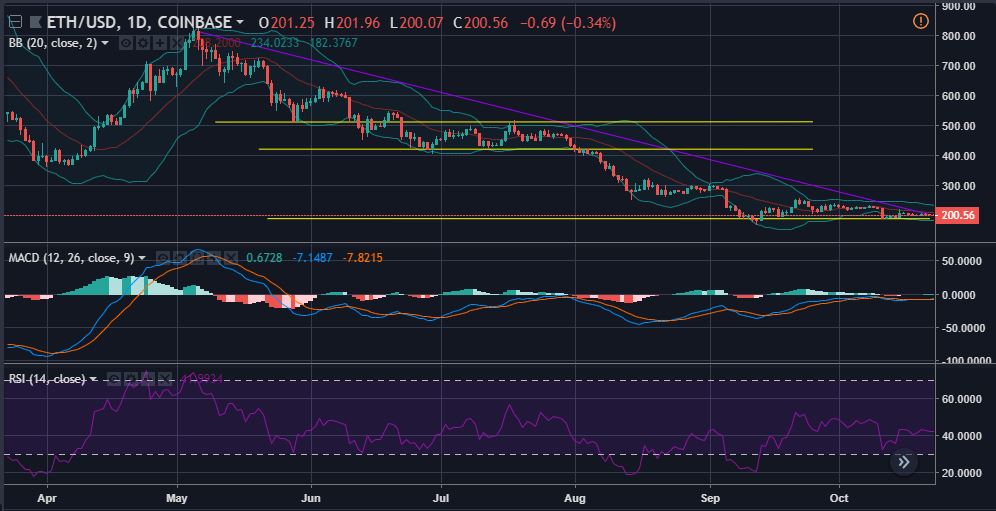
Since May, the ETH candlesticks have broken multiple support points to dive deeper into its doom. Some of the major supports invalidated by the coin are $510.9 [May] and $420.1 [June]. At present, the support is set around $182 to keep the prices from dropping steeper.
The Bollinger bands are predicting a low volatility, i.e., a sideways trend for the Ethereum market. The two bands are forming a tunnel-like structure, not giving much space for the prices to fluctuate.
The MACD is mild on the ETH price trend prediction and made a minor crossover through the signal in the bull’s favor. However, the reading line is not taking a clear stance on whether to move up or slide down.
Similarly, the RSI indicator is in the bearish zone of the ETH chart, but has refused to project any further depictions. It is currently moving straight into space, keeping the prediction neutral.
Conclusion:
In this technical analysis, it has been evident that the indicators have played a united game to make a sideways prediction for Ethereum. However, Parabolic SAR and Chaikin Money Flow in the 1-hour ETH candlesticks look bullish on the market in the short-term.


Article comments