Ethereum [ETH/USD] Technical Analysis: Sideways conundrum of market continues
![Ethereum [ETH/USD] Technical Analysis: Sideways conundrum of market continues](https://coinhub.news/img/ea/eafee96efee13a16199980e4af674cba_730_522.webp)
The cryptocurrency market is being torn apart by the battle between the bull and the bear. Ethereum, the second-largest cryptocurrency, is not being treated well by the market either. At the time of writing, the coin was trading at $206.9, with a market cap of $21.35 billion. The market was showing a drop of merely 1%, whereas the 24-hour trading volume was recorded at $1.5 billion.
1-hour:
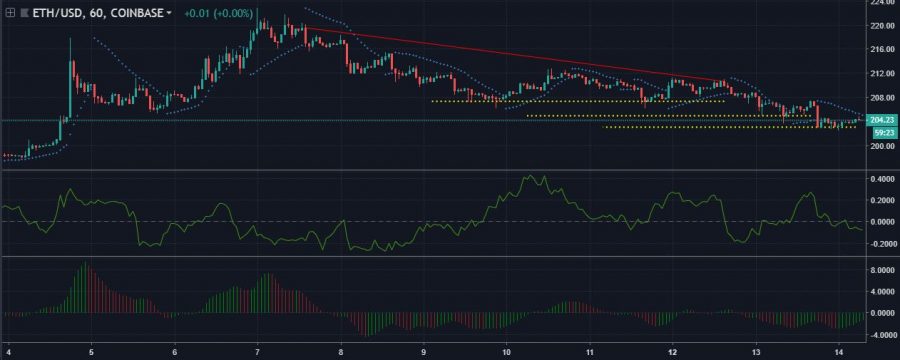
In the one-hour chart of ETH, the resistance line is extending from $219.6 to $210.6. There are multiple supports set one after the other.
A steep downtrend is visible in the Ether market as the support level set at $207.3 was broken and the prices plunged to $205. However, the support was also violated, with the most immediate support is currently fixed at $203.1.
The Parabolic SAR is slightly bearish on the coin, predictive of a negative market trend. This is visible by the position of the dots above the candlesticks.
The Chaikin Money Flow is floating below the 0-mark to side with the bear. The prediction is strengthened by the observation that the reading line is approaching downhill.
The Awesome Oscillator has walked away from the conventional prediction is flashing green at Ethereum.
1-day:
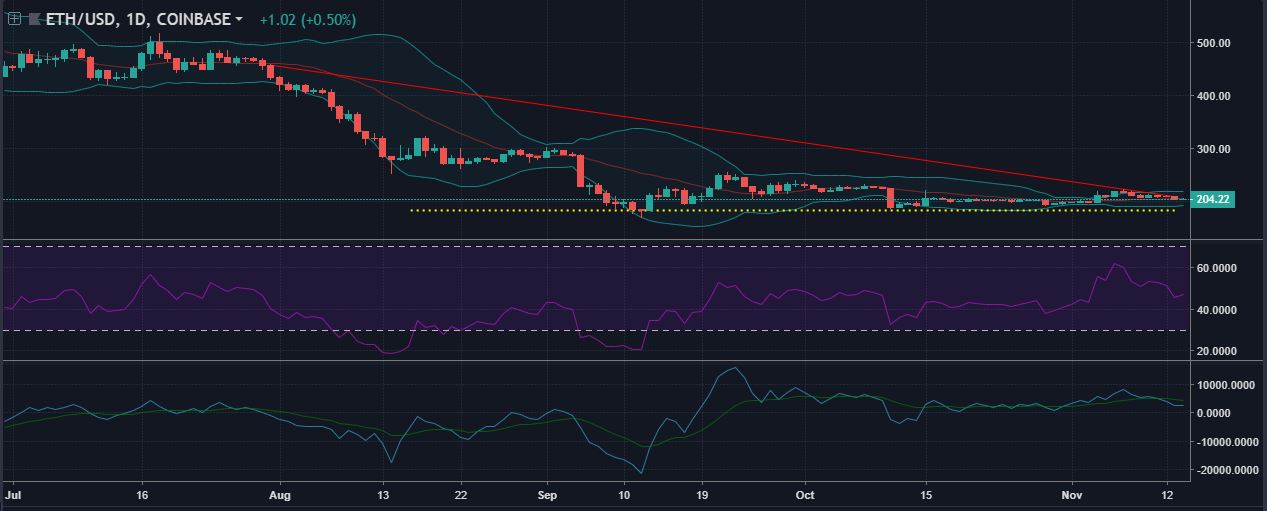
In this scenario, the ETH candlesticks are witnessing a downtrend from $455.6 to $209.2 with the support level set at $182.7. Furthermore, the lines are forming a descending triangle depicting a drop pattern in the crypto-market.
The Bollinger Bands is depicting a higher volatility in Ether’s current price trend. The bands were narrowing down but have returned to a widened pattern.
The RSI is slightly bullish on the cryptocurrency as the indicator is apparent to have taken an uphill approach.
The Klinger Oscillator made a bearish crossover by the signal line to flash a warning for the market. However, the reading line is taking a horizontal approach to project neutrality in speculation.
Conclusion:
In this technical analysis, there is a mixed response on the upcoming price trend of Ethereum. While three of the indicators suggest a bearish run for the token, namely, Parabolic SAR, Chaikin Money Flow, and Klinger Oscillator, the rest two have delivered a bullish outlook on the matter.


Article comments