Ethereum [ETH/USD] Technical Analysis: Mini bull run to fade as bear slowly gains ground
![Ethereum [ETH/USD] Technical Analysis: Mini bull run to fade as bear slowly gains ground](https://coinhub.news/img/a8/a80092d6c683079f90a395d9f165e4be_730_522.webp)
Last night [January 6], the whole cryptocurrency market lit up green within a fraction of an hour, with all top coins covered in green. The mini bull run continues to ride the market ahead.
According to CoinMarketCap, at press time, Ethereum [ETH] was trading at $156.44, with a market cap of $16.3 billion. The coin has a trading volume of $2.96 billion and has surged by over 14.32% in the past seven days.
1-hour

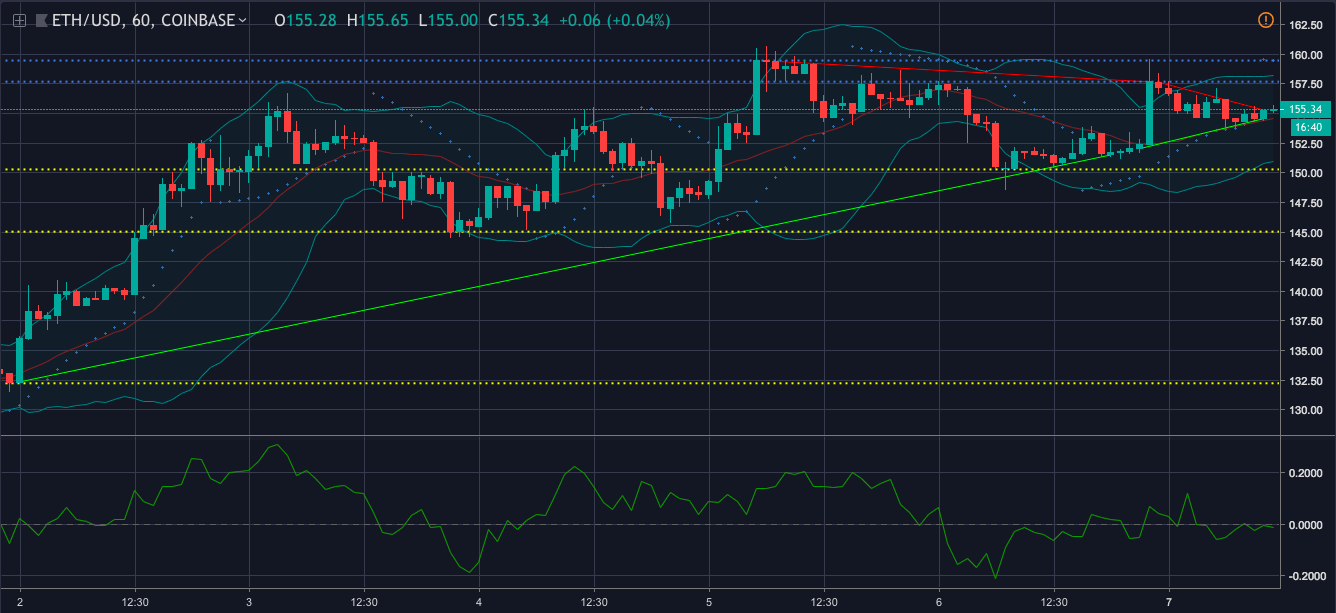
In the one-hour chart, the cryptocurrency demonstrates a downtrend from $159.40 to $157.67. It records another downtrend from $157.64 to $156.15, and further down to rest at $155.29. The coin has two notable uptrends, from $32.34 to $151.50 and from $152.03 to $154.57. The immediate resistance for the currency is set at $157.69 and the strong resistance at $159.47. The immediate support is placed at $150.28 and the strong support is at $132.23.
Parabolic SAR is showing that the effects of the bull run are wearing off and the bearish wave is going to engulf the market. This is evidenced as the dots have started to align on top of the candlesticks.
Chaikin Money Flow is also on the same page as the money has started to flow out of the market.
Bollinger Bands are forecasting a less volatile market for the cryptocurrency.
1-day

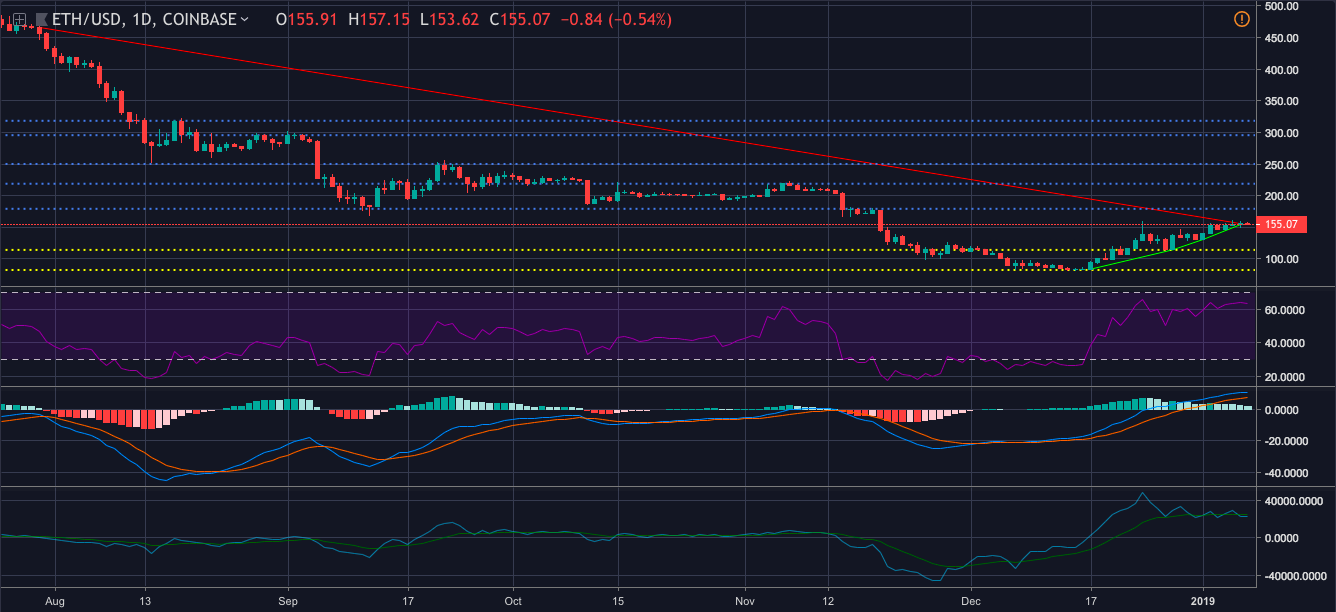
In the one-day chart, the downtrend is pictured from $466.01 to $155.92. The coin has three uptrends, the first from $83.74 to $114.53, the second from $114.53 to $130.66 and the third from $130.66 to $154.21. The immediate resistance for the coin can be seen at $179.29 and the strong resistance at $318.39. The immediate support for the coin is at $114.33 and the strong support at $82.62.
RSI is showing that the buying pressure and the selling pressure for the currency are currently evened out in the market.
Klinger Oscillator is forecasting a bearish market as the reading line and the signal line have made a crossover, with the reading line deciding to go down south.
MACD, on the contrary, is still showing a bullish trend as the moving line is pictured to be above the signal line after making a crossover.
Conclusion
Despite yesterday’s mini-run in the market, a majority of the indicators are forecasting a bearish wave. This includes Parabolic SAR, and Chaikin Money flow from the one-hour chart, and Klinger Oscillator from the one-day chart.


Article comments