Ethereum [ETH/USD] Technical Analysis: Interim bull run imminent, but bears still reign supreme
![Ethereum [ETH/USD] Technical Analysis: Interim bull run imminent, but bears still reign supreme](https://coinhub.news/img/4f/4f97332e57bf61a2e6812d3ae98562a2_730_522.webp)
Once the second-largest cryptocurrency in the world, Ethereum [ETH], has now dipped to the third position and has stayed put without putting up a fight to come back up.
At the time of writing, the price of Ethereum was $104.79, with a market cap $10.85 billion. The 24-hour change shows a massive drop of 8.59% and the trading volume is seen at $2.14 billion.
1-hour

Ethereum touched the double-digit price range recently but bounced back soon. The downtrend for the one-hour chart ranges from $175 to $104, with no uptrend visible in the horizon. The support at $100.93 is holding steady with the prices bouncing off of it twice. The resistance at $124, $148 and $177 have nothing to fear since the bear market is causing the prices to plummet.
The Parabolic SAR markers are spawning below the price candles, indicating a bullish move for Ethereum.
The MACD indicator is also showing a bullish crossover with the histogram sprouting green bars above the zero line.
The Awesome Oscillator shows the transition to green bars, which indicates that the short-term period is trending lower than the long-term period.
1-day
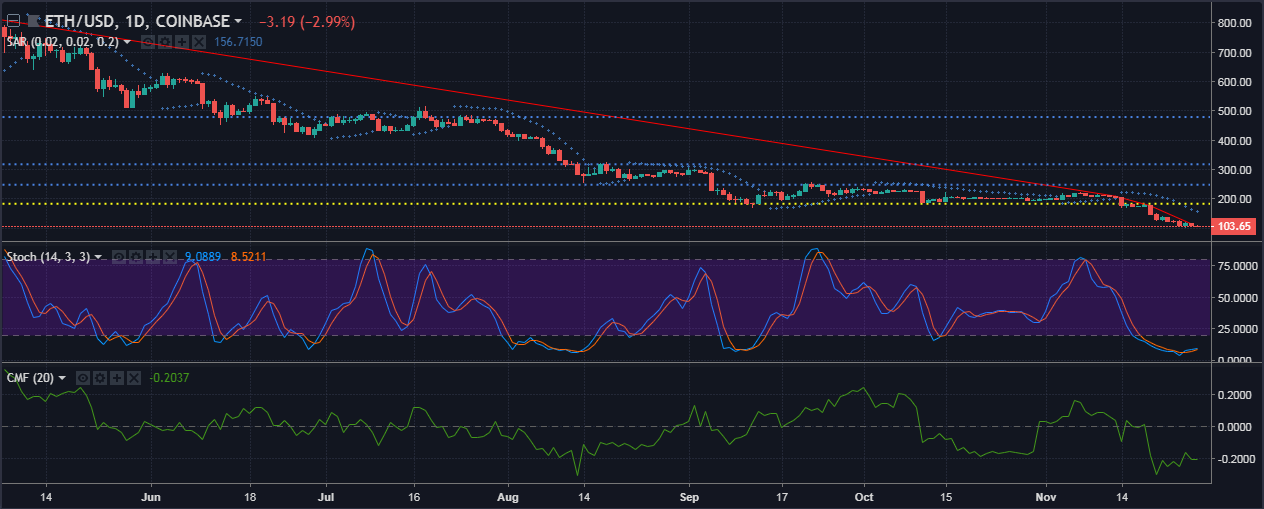
The uptrend for the one-day chart is not visible due to the bears dragging the prices to the ground. The downtrend extends from $812 to $114. The support at $182 has been breached and no support exists as of now. The resistance points for Ethereum are seen at $247, $317, and $478.
The Parabolic SAR indicators are showing a bearish downtrend since the bear markers are pressuring the price candles to dip.
The Stochastic indicator is showing multiple crossovers as it has dipped to the bottom.
The Chaikin Money Flow indicator is showing a sell-off as the money going out of the market far exceeds that of the money going into the market.
Conclusion
Ethereum looks bullish in a short-term one-hour chart as indicated by SAR and MACD, but the AO indicator is showing that the short-term period is lower than the long-term period. Unlike the one-hour chart, the one-day chart is showing massive bearish trend and sell-offs.


Article comments