Ethereum [ETH/USD] Technical Analysis: Cryptocurrency will continue to reside in the bull’s kingdom
![Ethereum [ETH/USD] Technical Analysis: Cryptocurrency will continue to reside in the bull’s kingdom](https://coinhub.news/img/72/72608a8c672dafb37ac7449ecda41c36_730_522.webp)
Ethereum, the second-largest cryptocurrency in the market, is rejoicing the bull’s reign along with all the other major altcoins. The coin, which was previously trading below the $200-mark, has bounced back above it.
According to CoinMarketCap, at press time, the coin was trading at $209.83 with a market cap of over $21 billion. The coin had a trading volume of more than $1 billion and has seen a significant rise of more than 6% in the past seven days.
1-hour
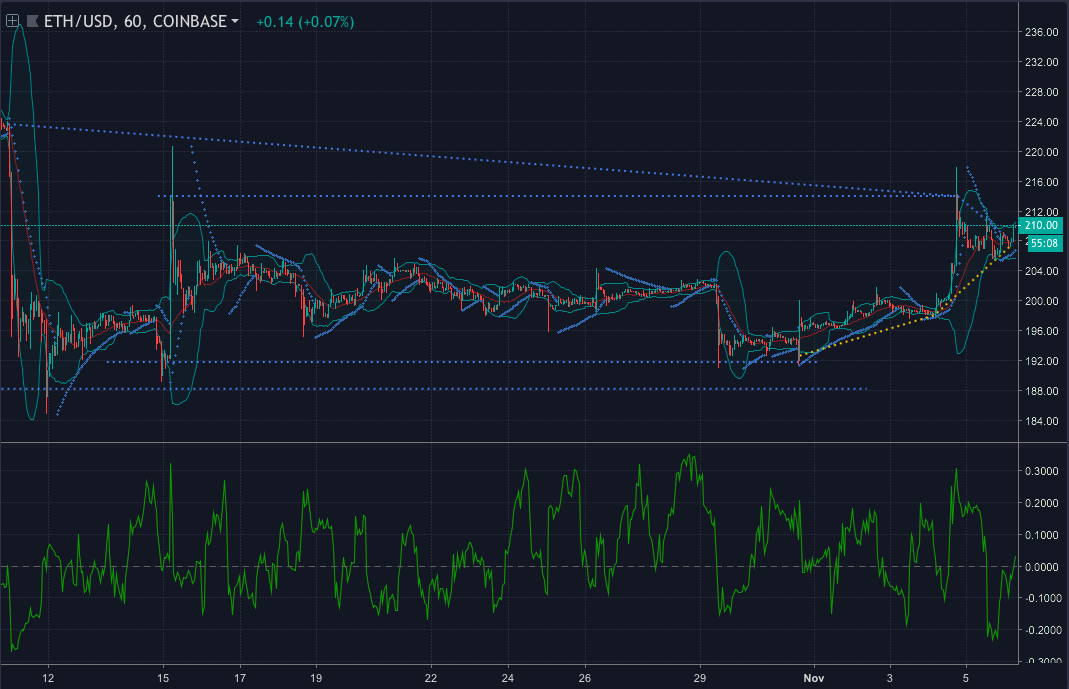
In the one-day chart, the coin will have to show its strong support to the bull to break through the immediate resistance, which is placed at $213. It will also face strong resistance at $223.67 level. The coin has an immediate support at $198, and has a strong support at $188.31.
The Parabolic SAR showed that it was prepared to ride the bull, as the dots had aligned below the candlesticks.
Chaikin Money Flow was also alongside the Parabolic SAR, showing a bullish trend as the money was flowing into the market.
Bollinger Bands showed that there would be less volatility in the market, as the bands were contracting at the time of writing.
1-day:
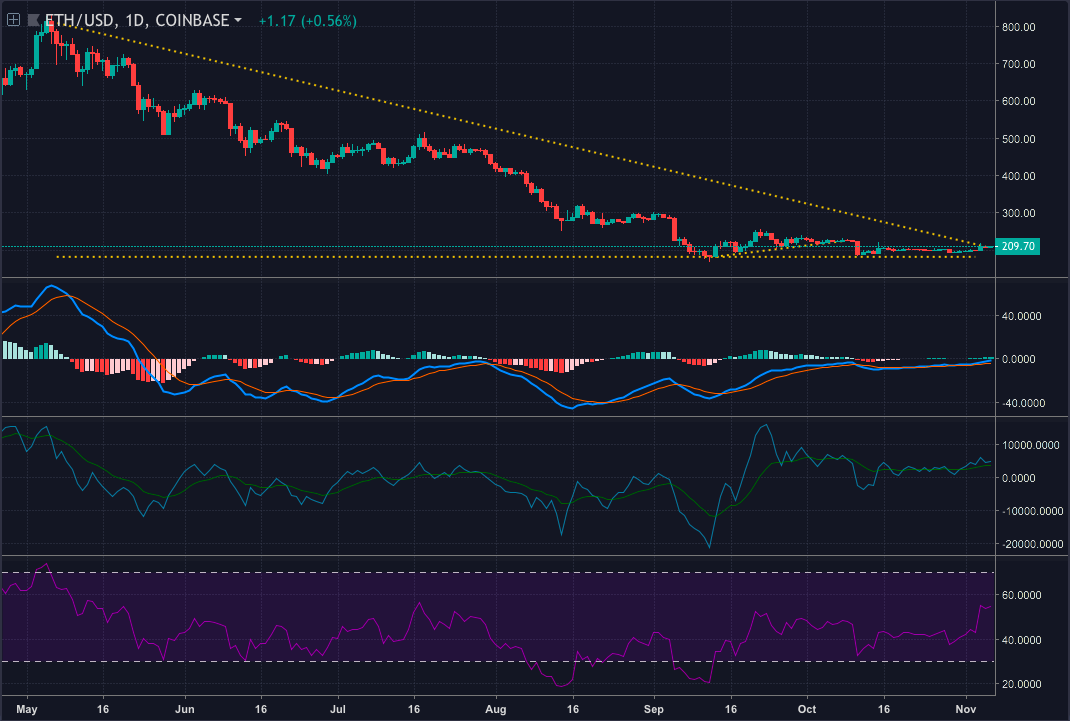
The one-day chart showed that the bull will have to pause at $210.31 to face the immediate resistance. If the bull breaks past this level, then it will be forced to face the strong resistance level, which is placed at $812.65. If the bull were to fail, then the coin will see a strong support at $182.79.
The Relative Strength Index showed that the buying and selling pressure of the coin is stabilizing.
The MACD indicator showed that it will side with the bull as the reading line was on top of the signal line.
The Klinger Oscillator was also on the same stance as the MACD, as the reading line showed that it was winning against the signal line.
Conclusion
The cryptocurrency will continue to reside in the bull’s kingdom alongside the MACD and Klinger Oscillator indicators from the one-day chart. The coin also gained the support for its decision from Parabolic SAR and CMF from the one-hour chart.


Article comments