Ethereum [ETH/USD] Technical Analysis: Cryptocurrency will be entertained by bull’s race
![Ethereum [ETH/USD] Technical Analysis: Cryptocurrency will be entertained by bull’s race](https://coinhub.news/img/89/896bd2b9d3abdd9383b0d49893c21a34_730_522.webp)
Ethereum [ETH], the second-biggest cryptocurrency by market cap, has continued to bleed red at the time of writing. The cryptocurrency has broken down to one of its lowest points ever since its all-time high at the beginning of this year.
According to CoinMarketCap, the coin was trading at $209.02, with a market cap of more than $21 billion on November 13. The cryptocurrency had a 24-hour trade volume of $1 billion and was down by over 1% in the past one-hour [at the time of writing].
1-hour:
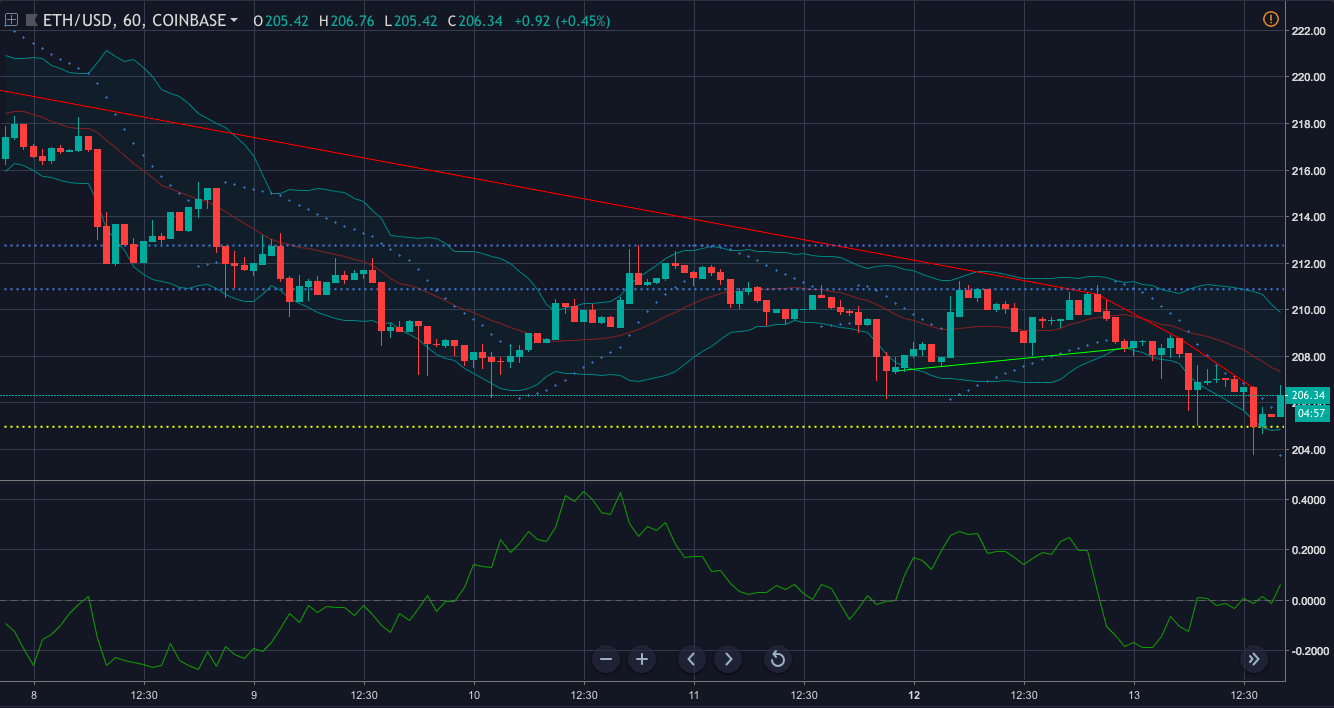
The Chaikin Money Flow indicator depicted that it was on the bull’s side of the market, as the money was flowing into the market.
Parabolic SAR was also on the same page as CMF as the dots had started to align below the candlesticks, predicting a bullish market.
The Bollinger Bands were expanding, forecasting a volatile market.
1-day:
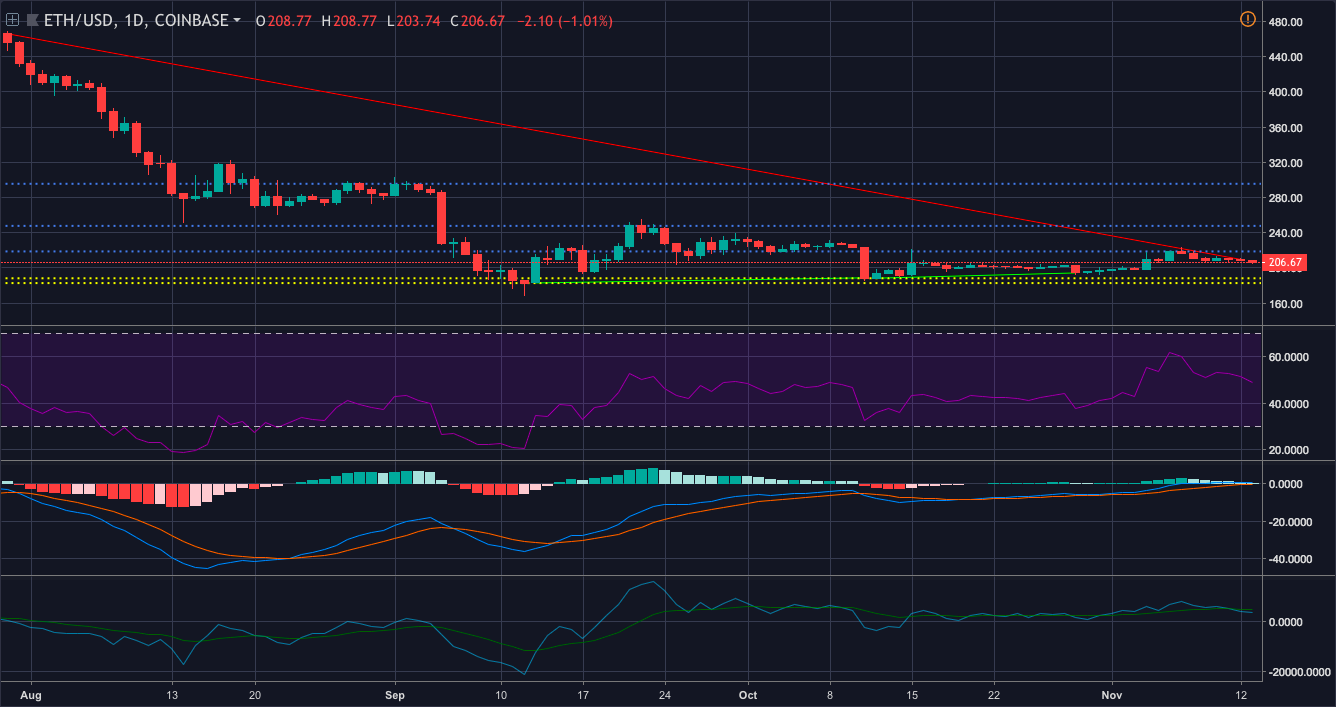
Nonetheless, if the market were to break the investors’ sentiment, then the cryptocurrency will be held up by the immediate support at $188.30. If this were to break, then the strong support is at $182.73
The RSI indicator showed that the buying pressure and the selling pressure for the coin are currently evened out.
MACD showed that the bull is up and ready for a race as the moving average was above the reading line
The Klinger Oscillator depicted that it was in no mood for the bull’s game as the reading line was below the signal line.
Conclusion
The second-largest cryptocurrency is forecasting that the bull will be entering the game soon, with the support of CMF and Parabolic SAR from the one-hour chart and MACD from the one-day chart.


Article comments