Ethereum [ETH/USD] Technical Analysis: Candles spy a bull on the horizon
![Ethereum [ETH/USD] Technical Analysis: Candles spy a bull on the horizon](https://coinhub.news/img/b3/b3e93ab40c2b9ae979701d4d575438ae_730_522.webp)
Ethereum, the second-largest cryptocurrency in the world, has taken a sideways approach yet again, pinning on the low volatility of all the coins across the board. At the time of writing, ETH was trading at $199.32, with a market cap of $20.5 billion. The 24-hour trading volume was recorded at $1.39 billion.
1-hour:
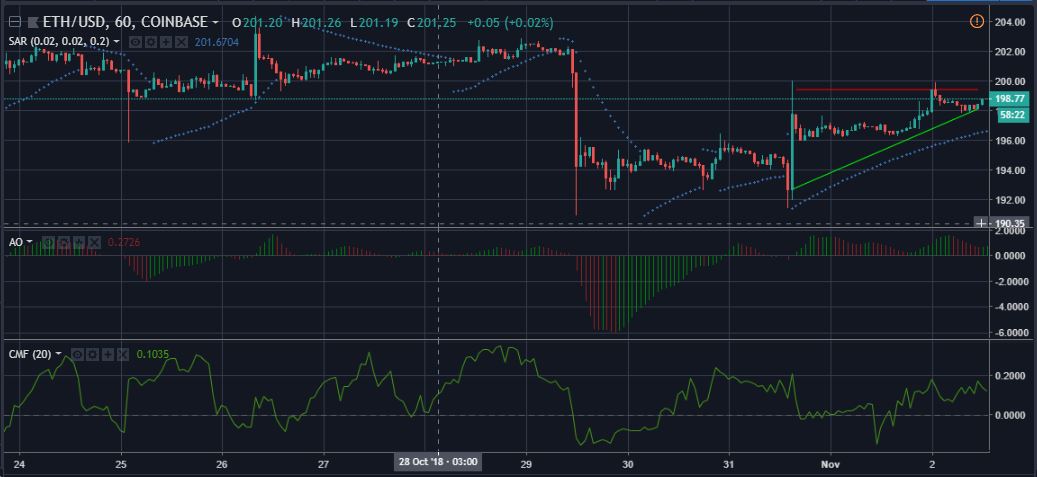
In the one-hour candlesticks for Ethereum, there is an uptrend is ranging from $192.71 to $198.12, whereas the resistance level is set at $199.42. As of now, there is no clear evidence of a trend breakout, but the support line is forming an ascending triangle with the resistance.
The Parabolic SAR is bullish on the cryptocurrency at the moment. The dots are aligned directly below the candlesticks, vouching for an upward price prediction for ETH.
The Awesome Oscillat0r is flashing a green light at the Ether price trend. The indicator is currently bullish on the market.
The Chaikin Money Flow is also traveling in the bullish zone as of now. The reading line is observed to be above the 0-mark, suggestive of a healthy market for the coin.
1-day:
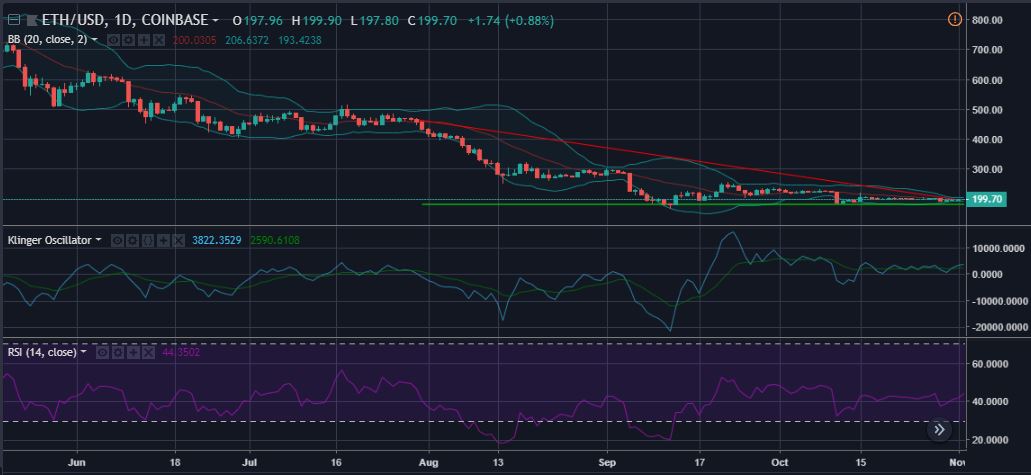
The Ether candlesticks, in this case, are presenting the support level at $182.98, with a downtrend ranging from $466.22 to $197.94. The resistance line is making a descending triangle with the support. However, a trend breakout is not visible in the foreseeable future.
The Bollinger Bands have narrowed down even further than before, dictating a less-volatile market for Ethereum.
The Klinger Oscillator has kept itself entwined around the signal line. The last crossover made by the indicator was bullish. Therefore, the indicator is on a positive path for ETH price prediction.
The RSI has also given a nod to the above prediction, currently moving upwards to strike a healthy speculation for the coin.
Conclusion
In the technical analysis, most of the indicators are suggestive of a bullish run for the cryptocurrency. However, the Bollinger bands are contradicting the prediction by speculating a lower volatility for the Ethereum market.


Article comments