Ethereum [ETH/USD] Technical Analysis: Bulls persist with the cryptocurrency on a long run
![Ethereum [ETH/USD] Technical Analysis: Bulls persist with the cryptocurrency on a long run](https://coinhub.news/img/67/67370a10cd72289c7ea013739862afe0_730_522.webp)
The cryptocurrency market began the year with an astonishing bull run which included the news of Ethereum [ETH] securing its second position back on the list by market capitalization.
At the time of writing, Ethereum [ETH] is trading at $156.14 with a market cap of $16.2 billion. The cryptocurrency was trading as low as $85 during the first week of December. However, towards the final week of the year, ETH showed decent progress and crossed the $100 mark and continued the bull run. The major trading volume of the digital asset is seen to be on the chinese exchange OEX, which is followed by OKEx and Binance.
1-hour:
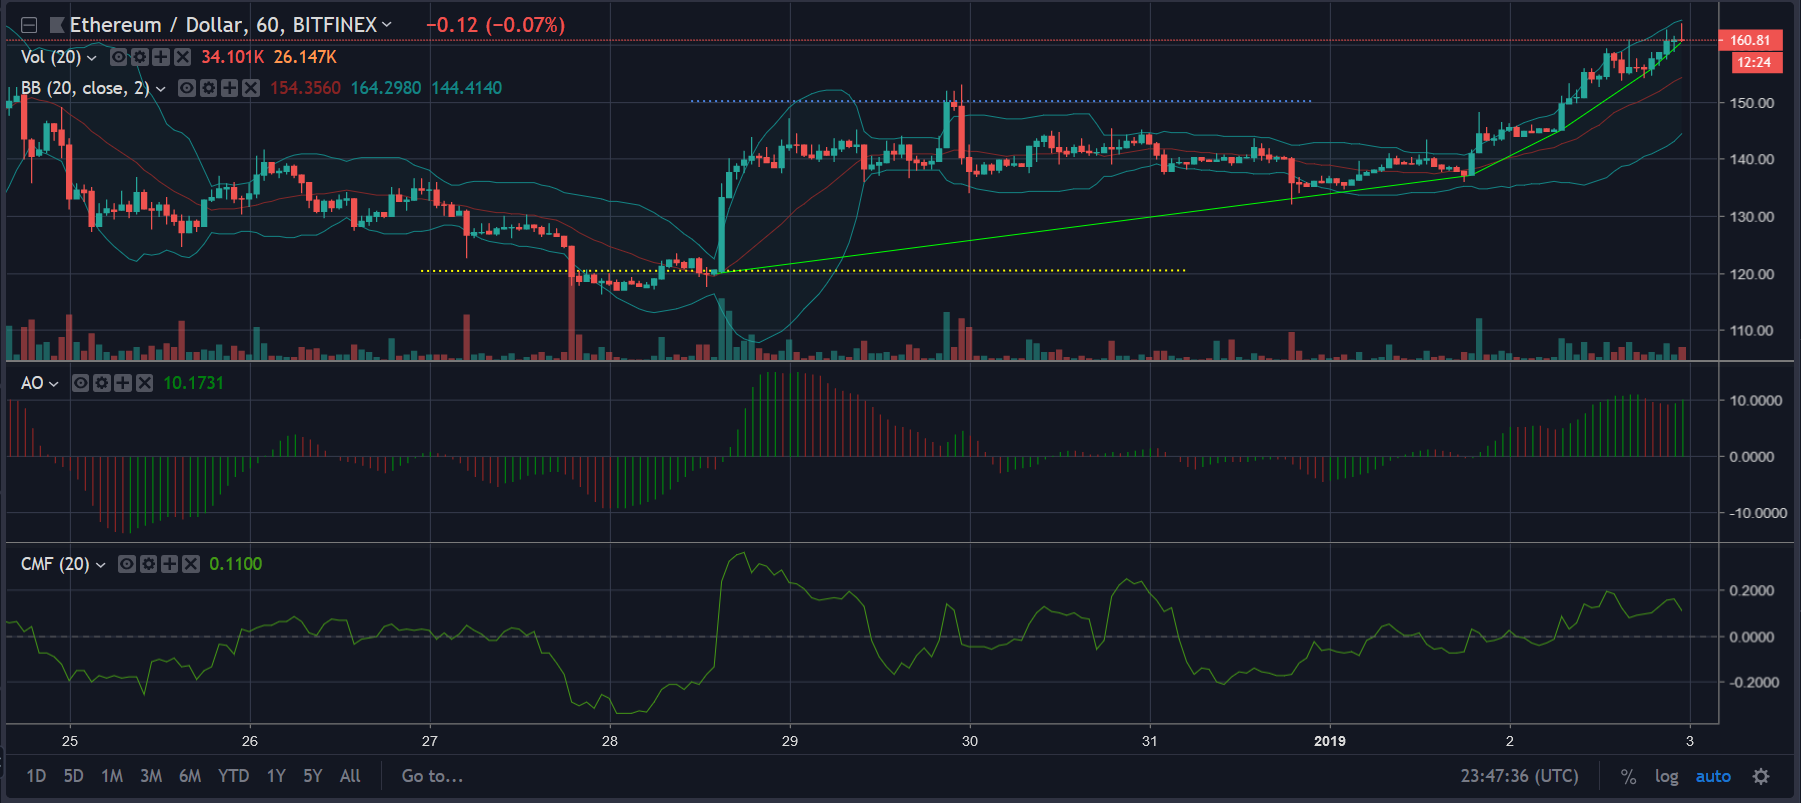
The hourly chart of Ethereum is currently showing a massive uptrend ranging between $120.35 – $138.52 – $160.6. The recent resistance point set at $149 has been broken by the cryptocurrency to reach the latest price. Also, it can be noticed that the support is fixed at $121.
The Bollinger Bands is currently showing a bullish run for ETH as the candlesticks are moving above the moving average line. After the major price breakout which took place on 28th December, the bands further narrowed down indicating a sudden breakout. This time it was again in favor of all the ETH hodlers with a significant rise. The Bollinger Bands remain in the expanded form indicating that there are chances of volatility in the ETH market.
The Awesome Oscillator indicates that the cryptocurrency continues to gain its momentum by holding the green spikes above the zero line on the histogram.
Chaikin Money Flow has moved above the zero line on 1st January and has sustained its journey in the same zone. This indicates that the inflow of money in the Ethereum market has increased compared to last month.
24 hours:
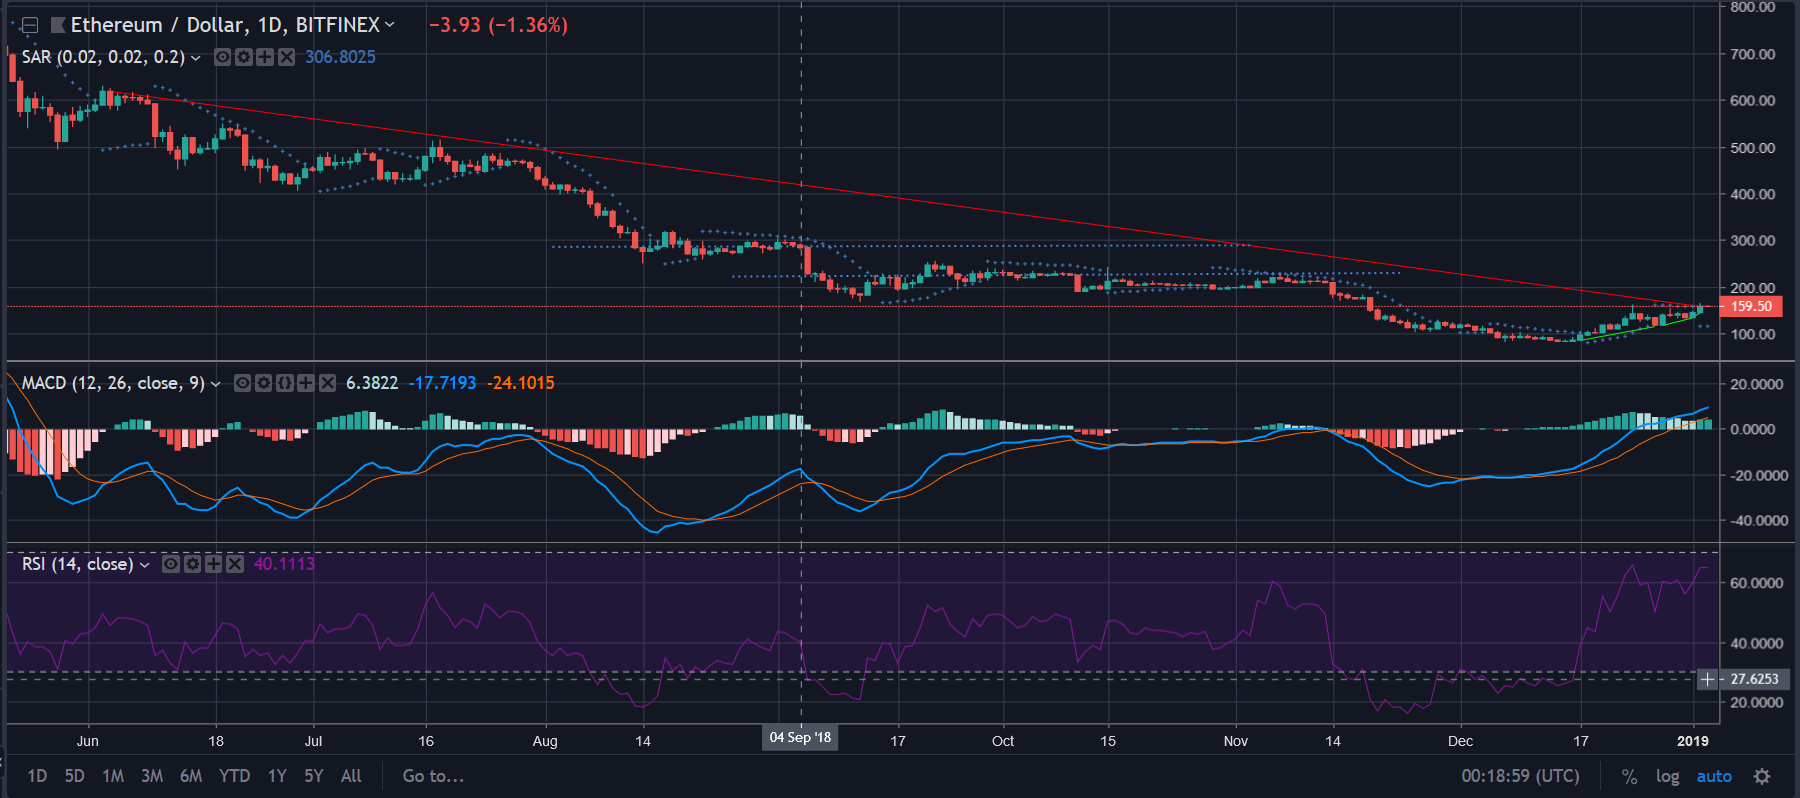
The daily chart of ETH shows a downtrend extending from $616 to $158.3 with resistance points set at $28.19 and $226.3. Also, there is an uptrend formed between $92.7 – $114 – $146.2.
The Parabolic SAR is slightly forming the dotted indicators below the candlesticks indicating a bullish trend for ETH.
The MACD has also taken a bullish crossover with both the moving average line and signal line moving upwards continuously. The MACD histogram is also forming green bars demonstaratig the bull run.
The Relative Strength Index [RSI] is currently moving very close to the overbought zone indicating a high buying pressure for the coin.
Conclusion:
The technical analysis demonstrates a bullish run for Ethereum in both the timeframes. All the indicators are clearly depicting a bright side for the cryptocurrency as it has moved back to the 2nd position.


Article comments