Ethereum [ETH/USD] Technical Analysis: Bull to be the knight in shining armour for coin
![Ethereum [ETH/USD] Technical Analysis: Bull to be the knight in shining armour for coin](https://coinhub.news/img/4a/4a20030be79d72e5375766cc35d7e62f_730_522.webp)
Ethereum [ETH], the third-largest cryptocurrency by market cap, is currently in the jaws of the bears. The coin, which used to be the second biggest currency, has now plunged to its lowest point for the year, crushing the sentiments of the investors.
According to CoinMarketCap, at press time, Ethereum was trading at $99.52, with a market cap of $10.31 billion. The coin shows a trade volume of $2.31 billion and has plunged by more than 7% in the past 24 hours. Notably, the previous time the cryptocurrency was trading at this level, is recorded to be in the month of May 2017, showing that the coin is not up for the run as that of December 2017.
1-hour
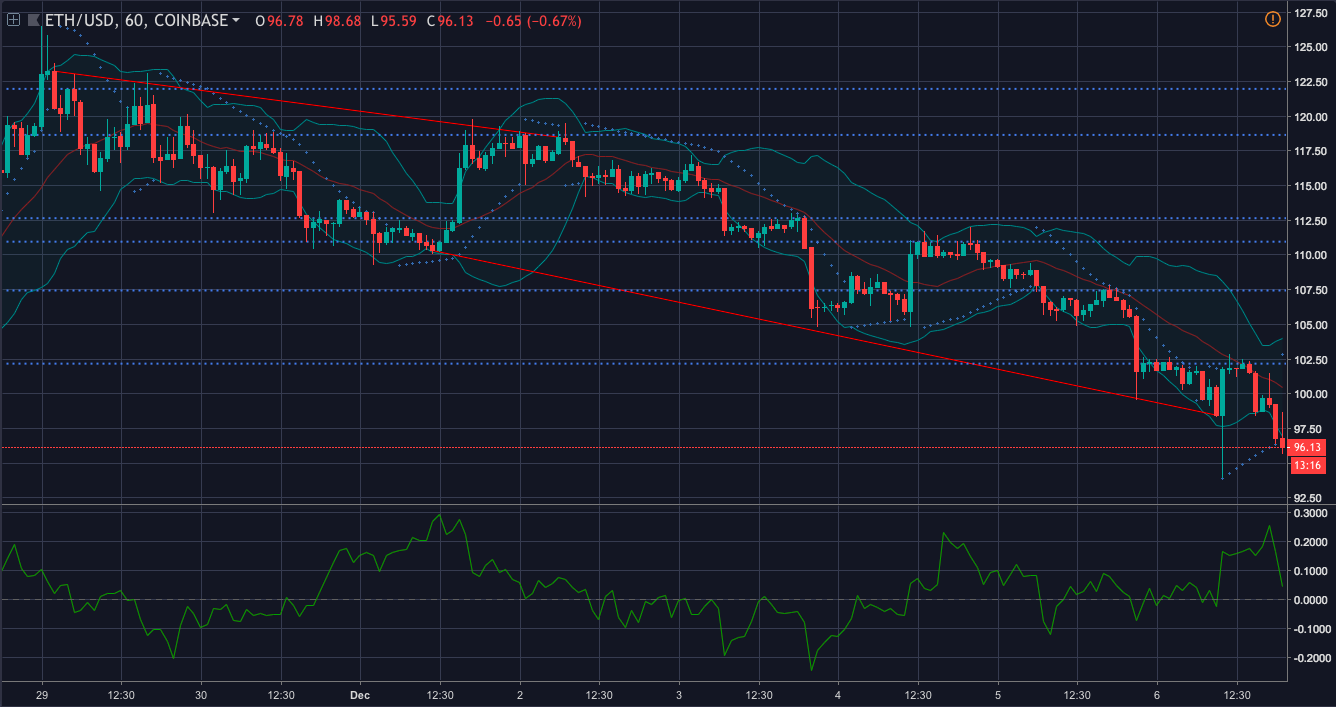
In the one-hour chart, Ethereum shows a downtrend from $123.25 to $118.49. It also records another steep fall from $101.32 to $98.46. The immediate resistance for the coin is at $102.17 and the strong resistance is at $107.44.
Parabolic SAR has thrown the coin to the bear’s clutches as the dots are aligned on top of the candlesticks.
Chaikin Money Flow, on the other hand, has convinced the bull to rescue the coin as the money has started to flow into the market.
Bollinger Bands have started to make more room for the duo with the bands expanding, predicting a more volatile market for the coin.
1-day
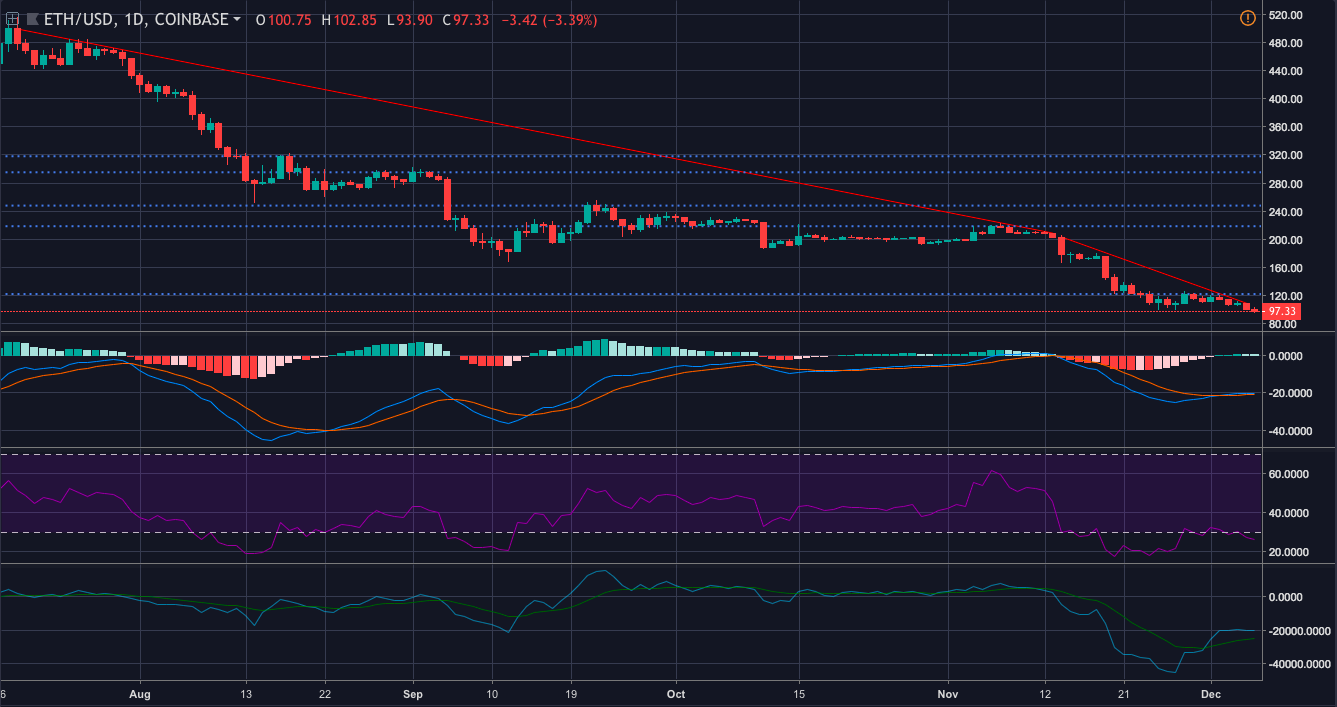
In the one-day chart, the coin shows a from downtrend $499.01 to $208.77 and another slope from $203.20 to $109.37. The immediate resistance is set at $122.20 and the strong resistance is at $218.60.
Klinger Oscillator has made a bullish crossover, showing that the coin still has hopes of returning to the bull’s realm.
MACD is also hoping the same, as the moving average line has made a bullish crossover.
RSI, however, has given up its ambition as it shows that the coin is oversold in the market.
Conclusion
The coin could be saved by the bull as it is pushed forward by Klinger Oscillator and MACD from the one-day chart and CMF from the one-hour chart. However, RSI from the one-day chart and Parabolic SAR from the one-hour chart are showing that their resolve is weak, which could have a negative impact on the coin.


Article comments