Ethereum [ETH/USD] Technical Analysis: Bull rally to occur in the market soon?
![Ethereum [ETH/USD] Technical Analysis: Bull rally to occur in the market soon?](https://coinhub.news/img/63/63cb46947a050bf599bb41ba21f8158e_730_522.webp)
Ethereum [ETH], the third-biggest cryptocurrency by market cap, seems to have effectively dodged the bear’s attack. The coin has been prepping to defeat the bear since the beginning of this week. The coin, which was trading at the $100-margin, has now successfully crossed the $110-mark.
According to CoinMarketCap, at press time, Ethereum was trading at $115.38, with a market cap of $11.94 billion. The trading volume of $2.56 billion and has surged by 7.72% in the past 24 hours.
1-hour
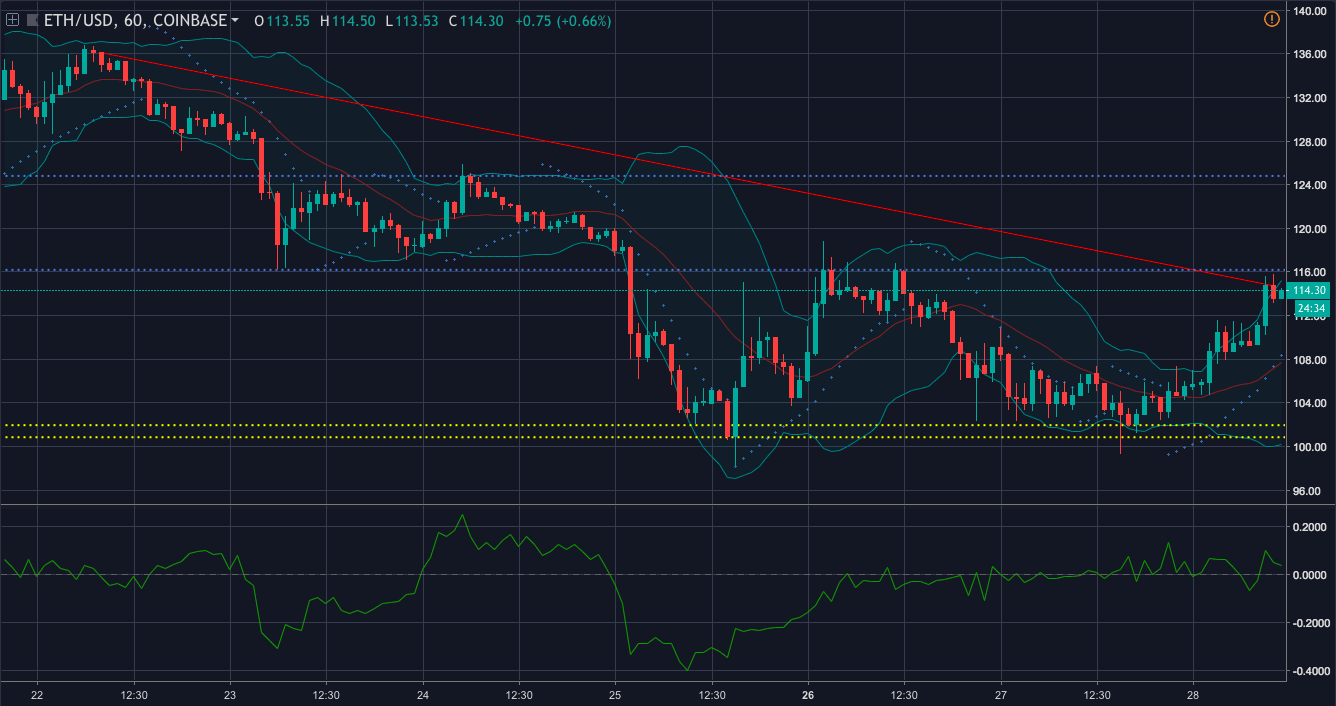
In the one-hour chart, the coin pictures a downtrend from $136.10 to $114.74. The chart also demonstrates that the coin has not formed a significant uptrend. The immediate resistance is set at $116.20 and the strong resistance is set $124.80. Ethereum has an immediate support level at $101.96 and a strong support level at $100.86.
Parabolic SAR is picturing a bull race as the dots have aligned below the candlesticks.
Bollinger Bands shows that the market is going to be volatile from hereon as the bands have started to part from each other.
Chaikin Money Flow demonstrates that the money is flowing into the market as the line is below the zero line.
1-day
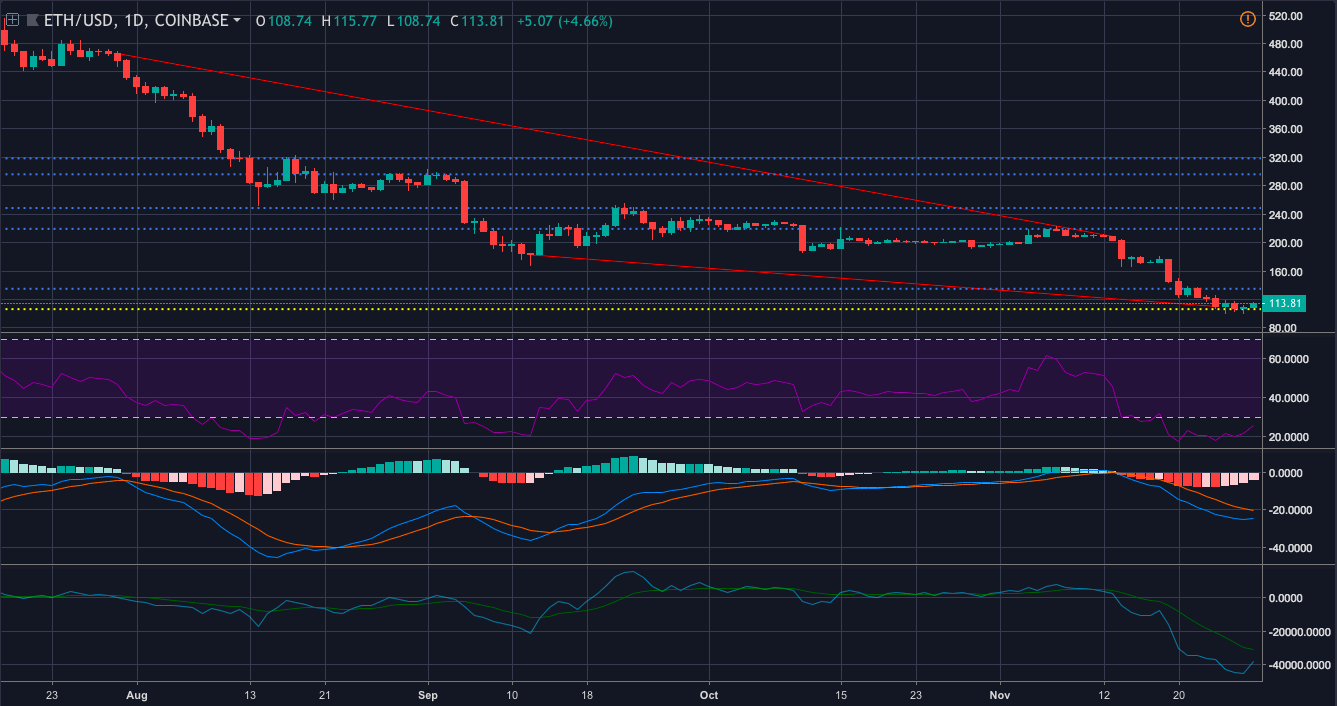
In the one-day chart, the coin has a downtrend from $466.01 to $208.77. It also records another steep fall from $182.79 to $110.16. The coin has an immediate resistance at $135.01 and a strong resistance at $318.48. The coin also has a support ground at $106.36.
RSI shows that despite the efforts, the coin is still in the bear’s realm. This is because the selling pressure is more than the buying pressure.
MACD also shows that the coin is still stuck in the bear’s kingdom as the moving average line has made a crossover to take the path down the hill.
Klinger Oscillator is on the same page as the other two indicators as the reading line has made a bearish crossover.
Conclusion
The one-hour chart shows that the bull has started its rally in the market with the support of Parabolic SAR and CMF indicators. Nonetheless, the one-day chart shows that the coin has a long way to go to step outside the bear’s realm as forecasted by RSI, MACD, and Klinger Oscillator.


Article comments