Ethereum [ETH/USD] Technical Analysis: Bull drags the bear down
![Ethereum [ETH/USD] Technical Analysis: Bull drags the bear down](https://coinhub.news/img/46/463b7957fd56d71b35de55b6a1539fdd_730_522.webp)
Ethereum [ETH], the third-largest cryptocurrency, has stepped into the new month painted red. The coin had started its journey to the top last year this time and it seems like the magic is now waved off as the currency is going downhill.
According to CoinMarketCap, at press time, Ethereum was trading at $112.35, with a market cap of $11.63 billion. The cryptocurrency has a trading volume of $2.06 billion and has plunged by 5.25% in the past 24 hours.
1-hour:
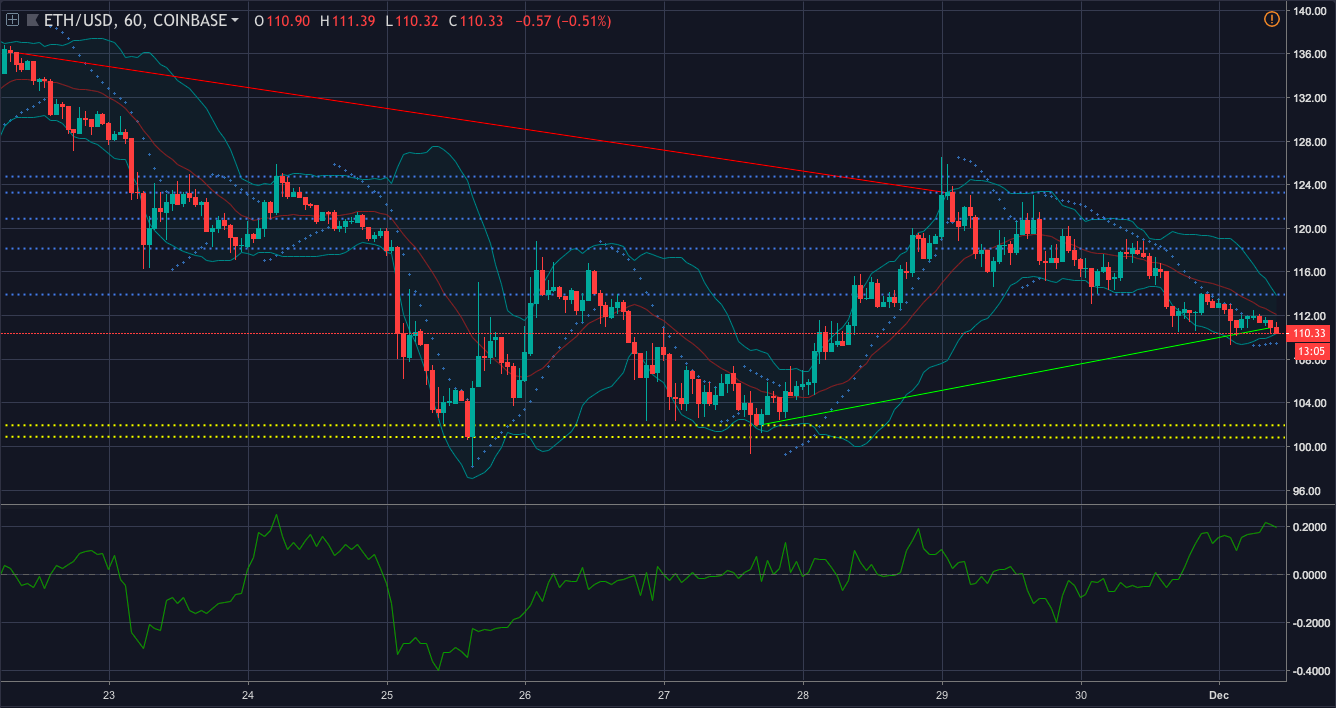
In the one-hour chart, the coin pictures an uptrend from $102.01 to $110.90. It also demonstrates a downtrend from $136.10 to $123.26. The coin has an immediate resistance at $113.93 and a strong resistance at $123.27. The immediate support for the coin is recorded at $101.98 and a strong support is at 100.93
Parabolic SAR is indicating a bullish wave as the dots have aligned below the candlesticks, pushing the coin in upwards direction.
Chaikin Money Flow also shares a bullish sentiment as the line is above the zero-mark, indicating that money has started to flow into the market.
Bollinger Bands are currently tightening, forecasting that the market is going to be less volatile for the coin.
1-day:
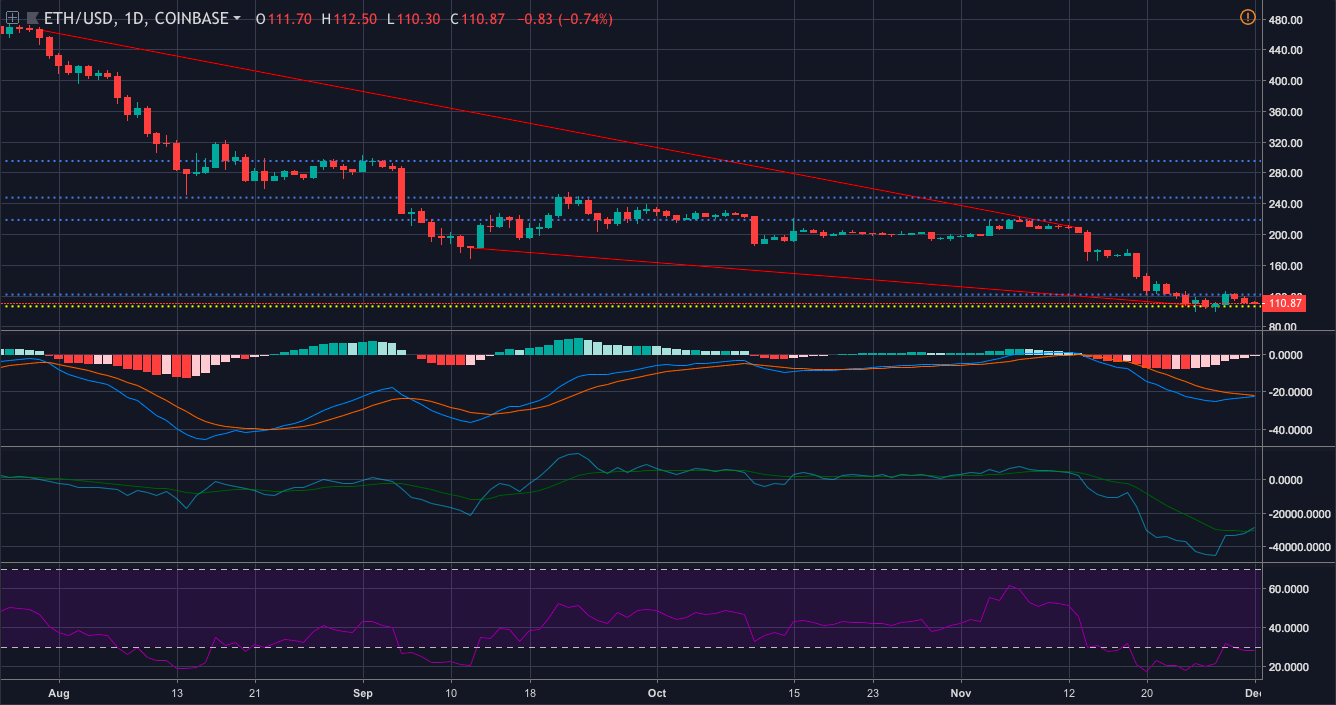
In the one-day chart, the coin has a downtrend from $466.01 to $208.77. The chart pictures another steep downtrend from $182.79 to $106.95. It has an immediate resistance at $122.07 and a strong resistance at $219.04. The coin has a strong support ground at $106.74.
RSI is currently showing a bearish trend as the selling pressure is more than the buying pressure.
Klinger Oscillator is on the bright side as the reading line has made a bullish crossover.
MACD is on the same page as the RSI as the moving average line has made a bearish crossover.
Conclusion
The bullish sentiment for the coin is supported by Parabolic SAR and CMF from the one-hour chart and Klinger Oscillator from the one-day chart. Whereas, the bearish sentiment is supported by MACD and RSI from the one-day chart.


Article comments