Ethereum [ETH/USD] Technical Analysis: Bull dives back in to save the coin again
![Ethereum [ETH/USD] Technical Analysis: Bull dives back in to save the coin again](https://coinhub.news/img/33/3337829d9a7e407114d223a33c8c4322_730_522.webp)
Yesterday, the whole market witnessed all the major cryptocurrencies hitting a new low for the year. Contrary to the investors’ expectations, instead of taking the upward direction, the cryptocurrencies are going the opposite direction.
According to CoinMarketCap, at press time, Ethereum was trading at $83.23 on Coinbase and has an overall market cap of $8.78 billion. The coin has a trading volume of $1.6 billion and has plunged by over 8% in the past seven days.
1-hour
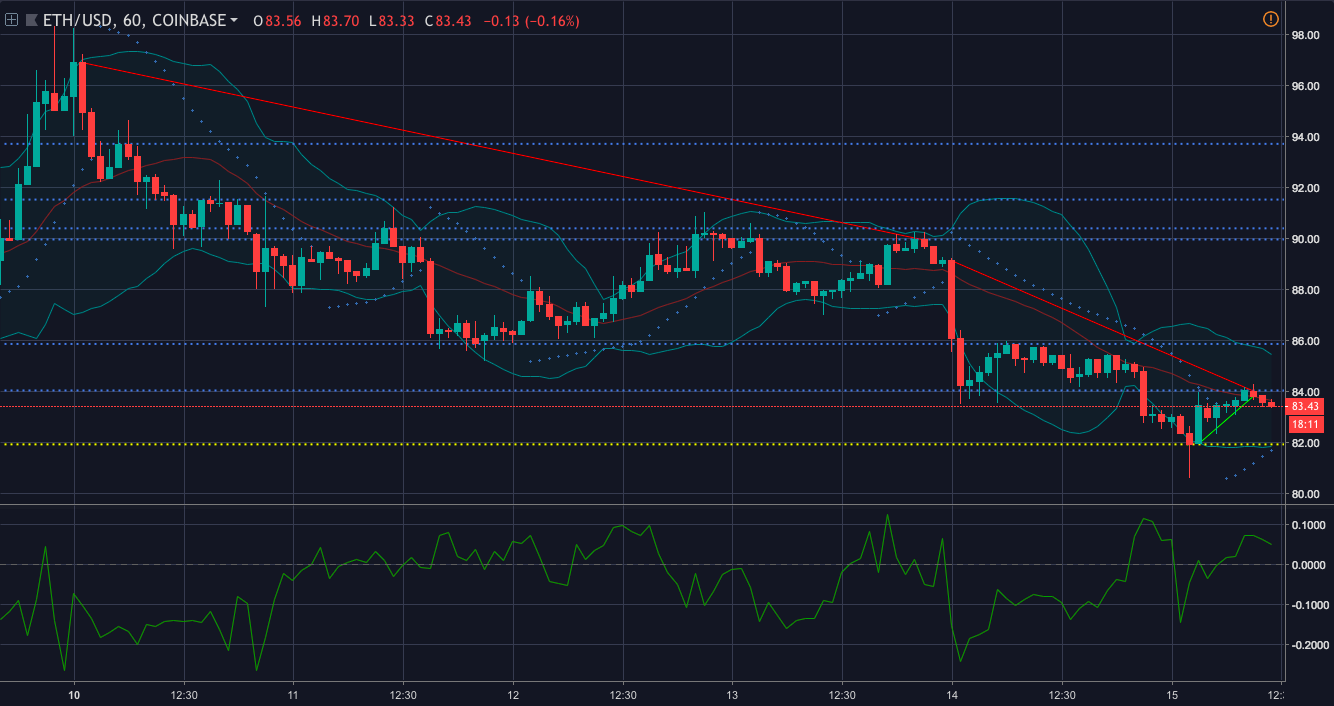
In the one-hour chart, the coin has a downtrend from $96.89 to $89.94. The coin shows another steep fall from $89.13 to $84.02. The chart also records an uptrend from $81.95 to $83.82. It has immediate resistance at $85.86 and the strong resistance is at $89.96. The support ground for the cryptocurrency is at $81.93.
Parabolic SAR is forecasting a bullish trend as the dots have aligned below the candlesticks.
Chaikin Money Flow is also bullish for the cryptocurrency as it demonstrates that the money is flowing into the market.
Bollinger Bands are predicting a less volatile market for the coin as the bands have started to converge.
1-day
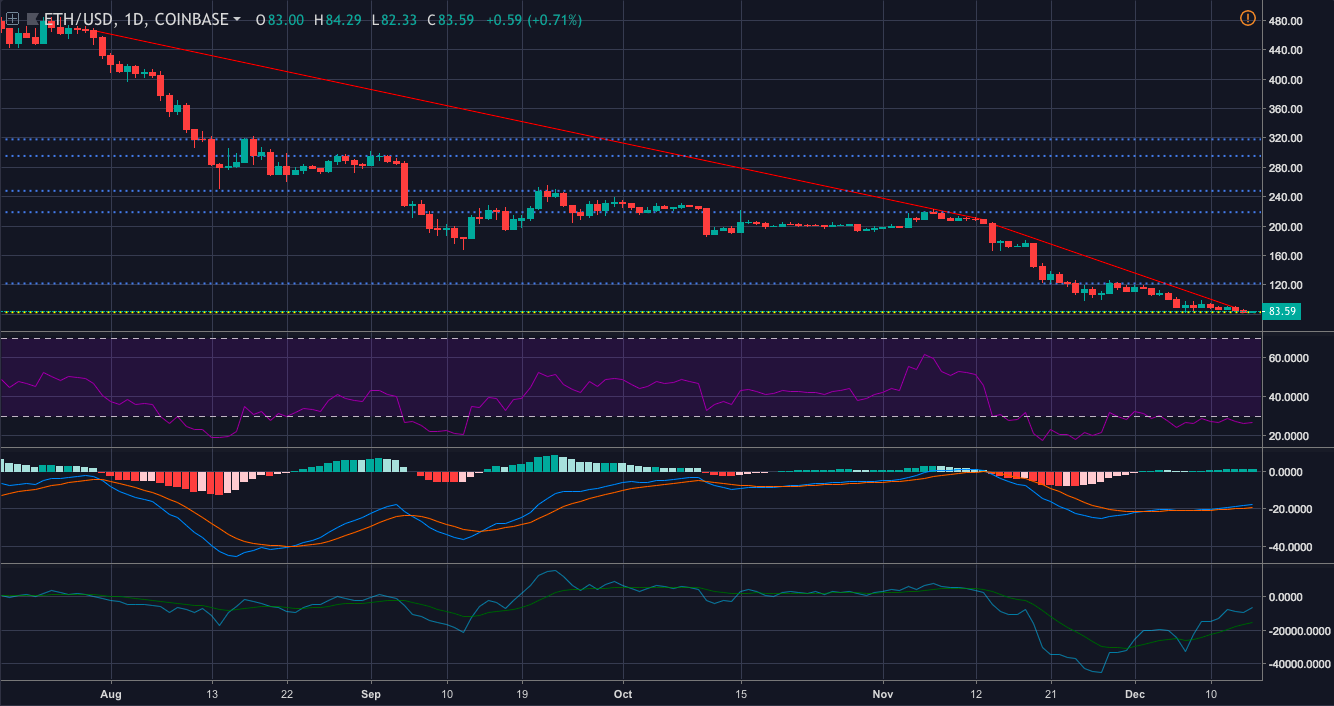
In the one-day chart, the coin pictures a downtrend from $466.01 to $208.77. It also shows that the coin continued to fall further from $203.20 to $89.02. The immediate resistance is set at $122.07 and the strong resistance is set at $219.01. The support has found its ground at $82.95.
RSI is showing that the selling pressure for the coin is more than the buying pressure, indicating a bear’s wave.
MACD is on the bull’s side as the moving average line has made a crossover to only reach the top.
Klinger Oscillator shows that the reading line has also made a bullish crossover.
Conclusion
The bull has returned to ensure that the coin is not crushed by the bear. It was persuaded to return by MACD and Klinger Oscillator from the one-day chart, and Parabolic SAR and CMF from the one-hour chart.


Article comments