Ethereum [ETH/USD] Technical Analysis: Bull and Bear to collide in the market again
![Ethereum [ETH/USD] Technical Analysis: Bull and Bear to collide in the market again](https://coinhub.news/img/89/896c23ca8a083dee937cd210b8162f98_730_522.webp)
The year started with the whole cryptocurrency market painted red. Despite the bear’s strong presence, there were a few coins that performed better than others. This includes Ethereum [ETH], the second largest cryptocurrency, as the coin has already started to show signs of recovery.
According to CoinMarketCap, at press time, Ethereum was trading at $153.61 with a market cap of $16.01 billion. The recorded a trading volume of $2.29 billion and has seen a rise of over 13% in the past seven days.
1-hour
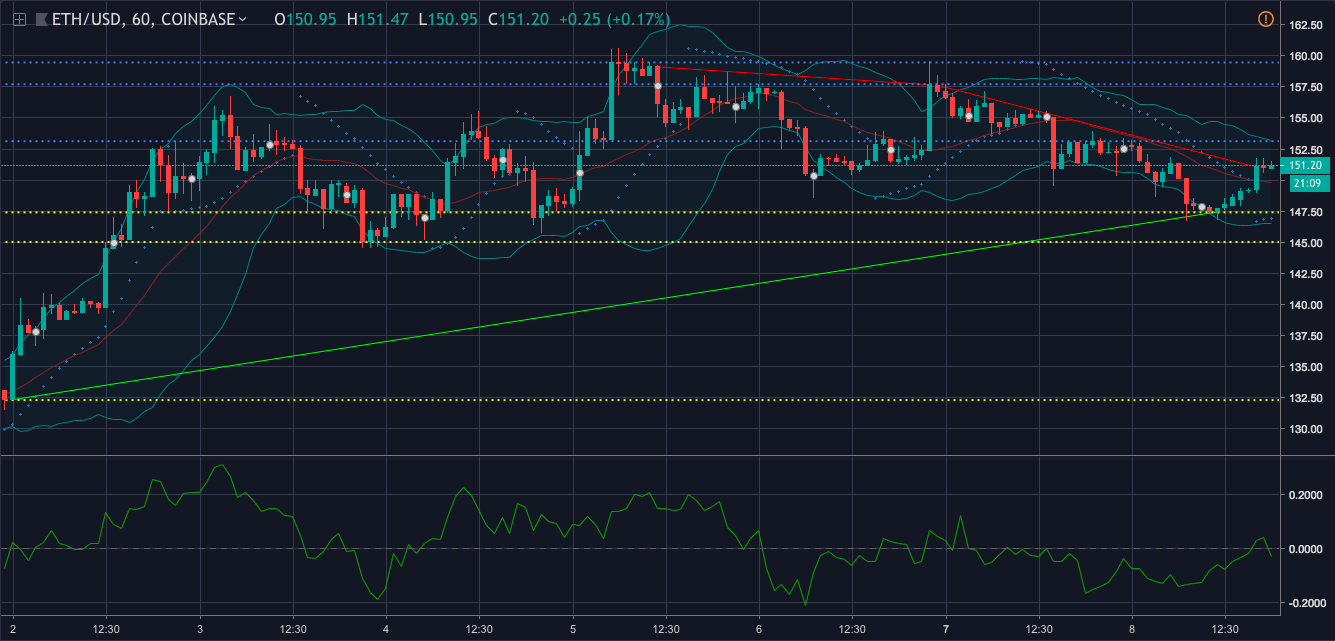
In the one-hour chart, the coin has a downtrend from $159.11 to $157.67. It pictures another fall from $157.64 to $151.06. The uptrend for the cryptocurrency is from $132.34 to $147.44. The immediate resistance for the coin can be spotted at $153.13 and the strong resistance is placed at $159.46. Whereas, the immediate support is at $147.41 and the strong support is at $132.31.
Chaikin Money Flow is forecasting a bearish market as the money has started to flow outside the market.
Bollinger Bands is predicting a volatile market for the cryptocurrency as the bands have started to expand.
Parabolic SAR, on the contrary, is showing a bullish wave as the dots have started to align below the candlesticks.
1-day
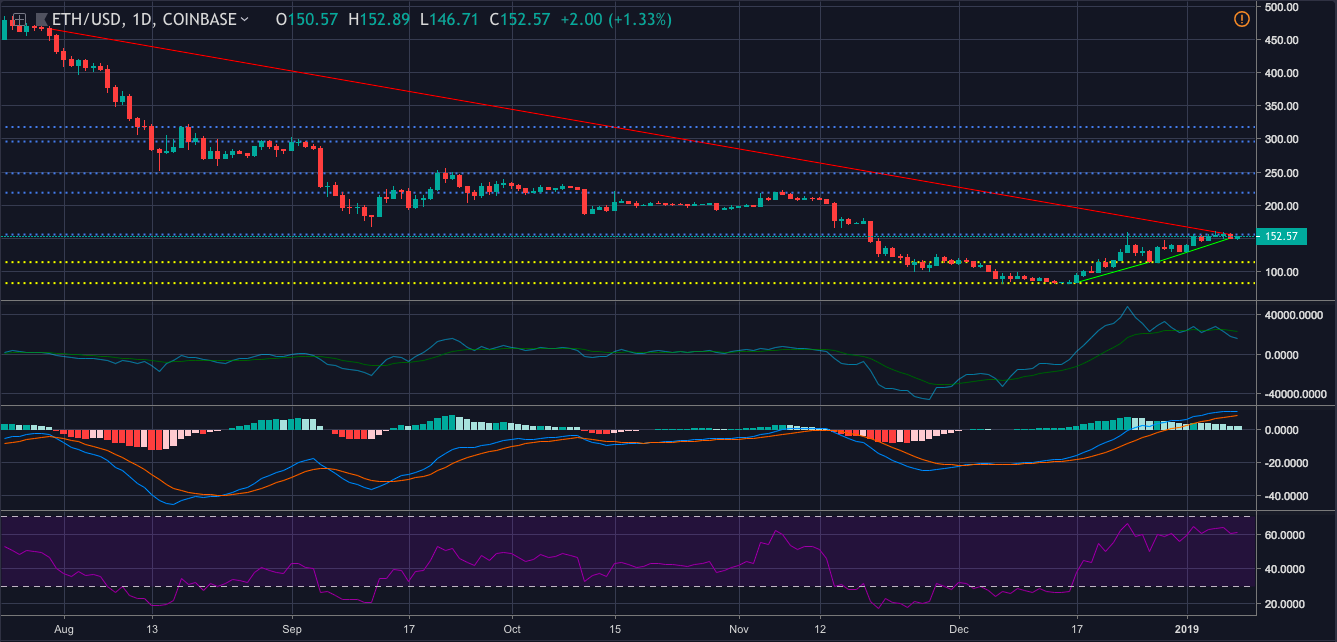
In the one-day chart, the cryptocurrency demonstrates a downtrend from $466.01 to $155.91. The uptrend for the coin is recorded from $83.51 to $114.63, and from $114.53 to $150.62. The immediate resistance for the coin is at $155.97 and the strong resistance is at $218.94. The chart shows that the immediate support has found its ground at $114.33 and the strong support is at $82.75.
Klinger Oscillator has tagged alongside the bear as the reading line and the signal line have encountered a crossover, with the reading line going south.
MACD continues to show a bullish market as the moving average line has maintained its position above the signal line, after a crossover.
RSI is showing that the buying pressure and the selling pressure for the coin have evened out in the market.
Conclusion
The bull and the bear would probably engage in a fight soon. The bull is currently being supported by the MACD from the one-day chart and Parabolic SAR from the one-hour chart. The bear has found the allegiance of Klinger Oscillator from the one-day chart and CMF from the one-day chart.


Article comments