Ethereum [ETH/USD] Technical Analysis: Bear’s win is crystal clear in the market
![Ethereum [ETH/USD] Technical Analysis: Bear’s win is crystal clear in the market](https://coinhub.news/img/4c/4c87d04841904e65f25d170af8bcf43f_730_522.webp)
Ethereum [ETH], the cryptocurrency which was once the second biggest cryptocurrency by market cap, seems to be enjoying its third position. The coin that lost to XRP has succumbed to the bear has it continues to make new low records.
According to CoinMarketCap, at press time, Ethereum is trading at $132 with a market cap of $132.73. It has a trading volume of $2.25 billion and has plummeted in the market by 24.94% in the past seven days.
1 hour:
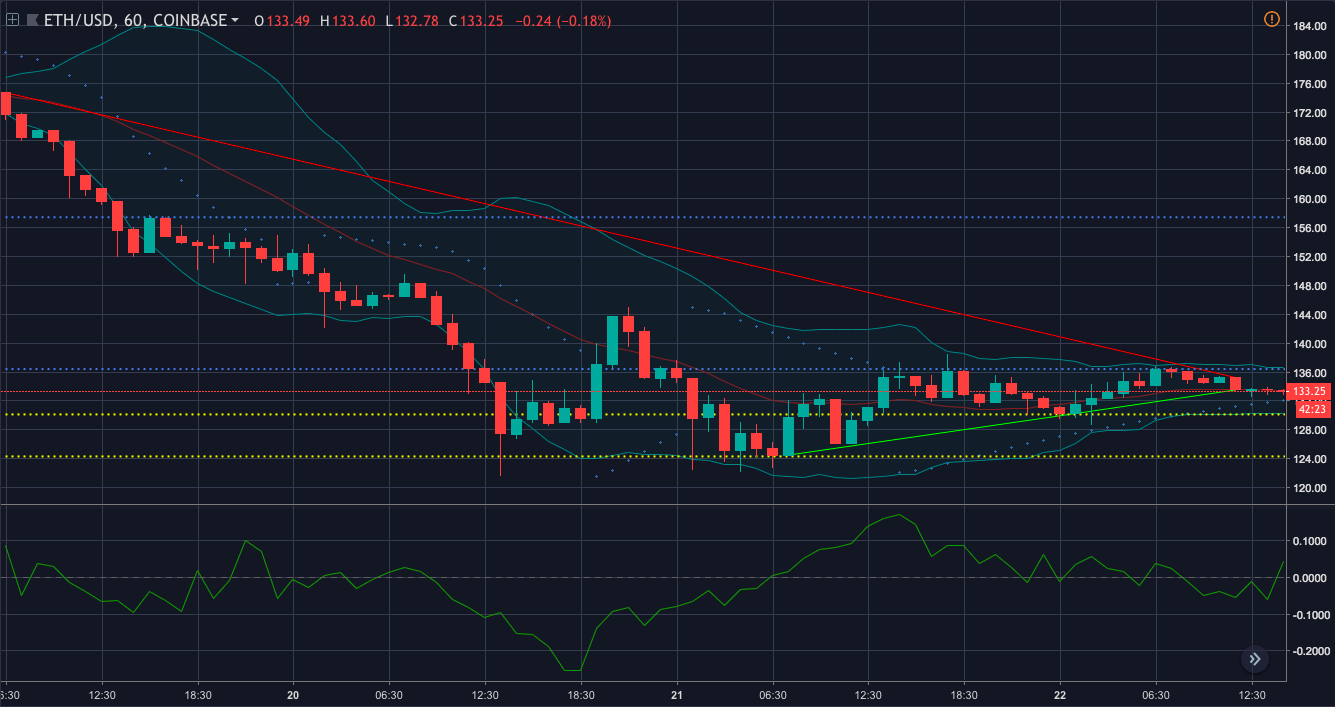
In the one-hour chart, the coin shows a downtrend from $174.70 to $135.26. It pictures an uptrend from $124.50 to $130.26, and further up to rest at $133.52. The cryptocurrency demonstrates an immediate resistance at $136.42 and a strong resistance at $157.44. The coin has a immediate support $130.14 and a strong support at $124.32.
The Bollinger Bands are indicating that the bands are trying to get closer to each other, demonstrating a less volatile market for the cryptocurrency.
Parabolic SAR is currently picturing the bull’s grand entry in the market as the dots have aligned below the candlesticks.
Chaikin Money Flow is also applauding the bull’s entry as the indicator depicts that the money is flowing in the market as the CMF line is above the zero line.
1 day:
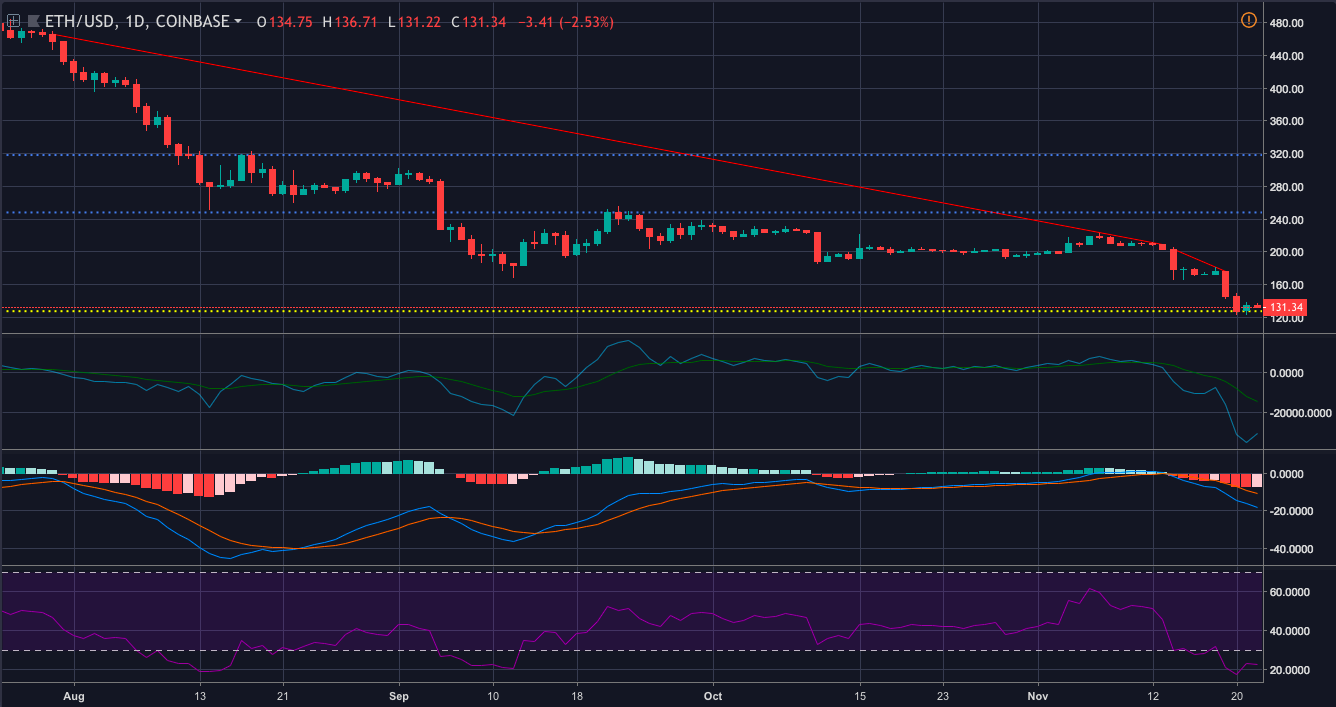
In the one-day chart, the cryptocurrency is showing a steep decline from $466.01 to $208.77 and further down from $203.20 to $175.90. The coin has an immediate resistance at $248.01 and a strong resistance at $318.20. It has a strong support at $127.32.
Klinger Oscillator is cheering for the bear as the reading line is well-below the signal line.
MACD is walking beside the bear in the market, as the moving average is below the signal line.
It is followed by RSI as the indicator depicts that the coin is in an oversold zone right now, making room for a possible recovery.
Conclusion:
The bear’s win is crystal clear, especially with the support of all the key indicators from the one-day chart. Nonetheless, the bull has managed to gain the attention of Parabolic SAR and Chaikin Money Flow from the one-hour chart.


Article comments