Ethereum [ETH/USD] Technical Analysis: Bearish market to continue as bulls ready for conflict
![Ethereum [ETH/USD] Technical Analysis: Bearish market to continue as bulls ready for conflict](https://coinhub.news/img/06/06b9e5627198704eedbe3bcd384dc17c_730_522.webp)
Ethereum [ETH], the third-largest cryptocurrency, seems to be conflicted as it is forced to chose between the bull and the bear. The coin, which has been playing around with both sides of the market, is currently showing its preference to the bear more than the bull.
According to CoinMarketCap, at press time, Ethereum was trading at $113.06, with a market cap of $11.75 billion. The coin has a trading volume of $1.84 billion and has plunged by 3.24% in the past 24 hours.
1-hour
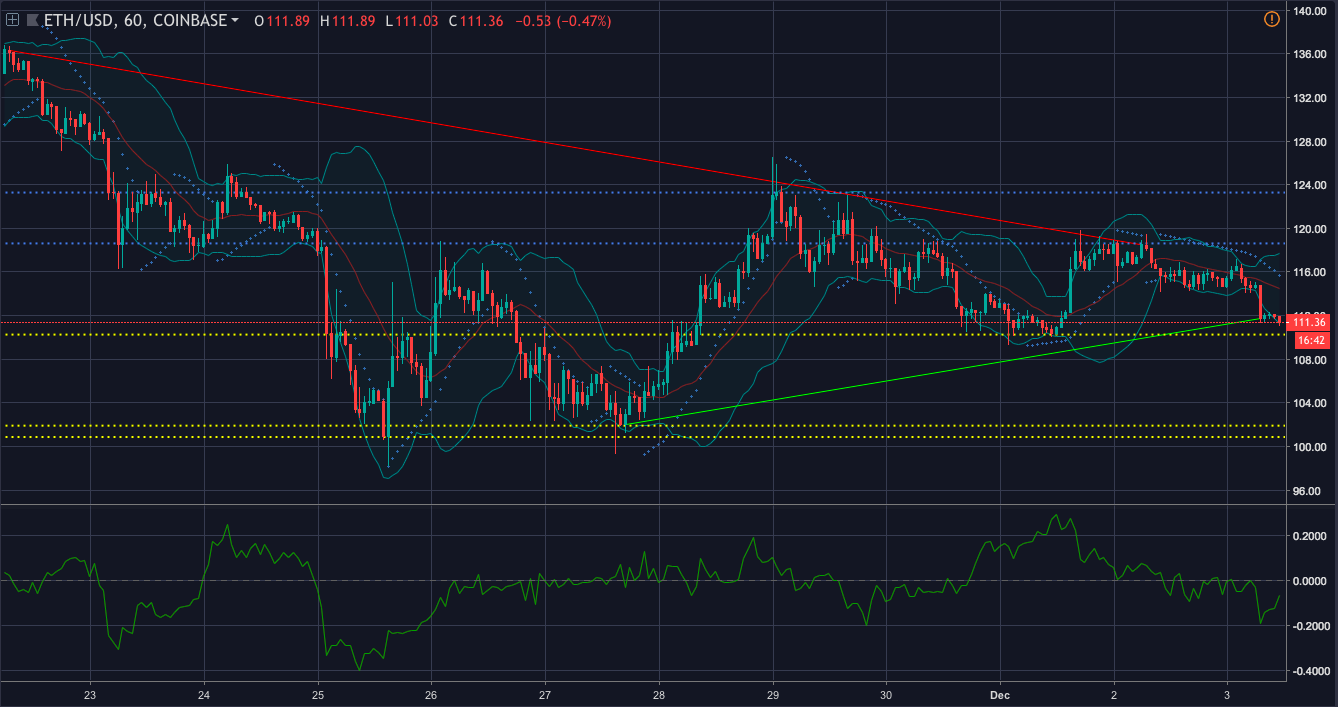
In the one-hour chart, the coin depicts a downtrend from $136.31 to $118.49. It also demonstrates an uptrend from $102.01 to $111.73. The coin has an immediate resistance at $118.62 and a strong resistance point at $123.28. It has an immediate support at $110.26 and a strong support ground at $100.88.
Parabolic SAR is currently showing a bearish trend as the dots have aligned above the candlesticks.
Chaikin Money Flow is demonstrating that the money is flowing outside the market as the line is below the zero-mark, showing its support to the bear.
Bollinger Bands are picturing the bands moving away from each other, forecasting a volatile market for the coin.
1-day
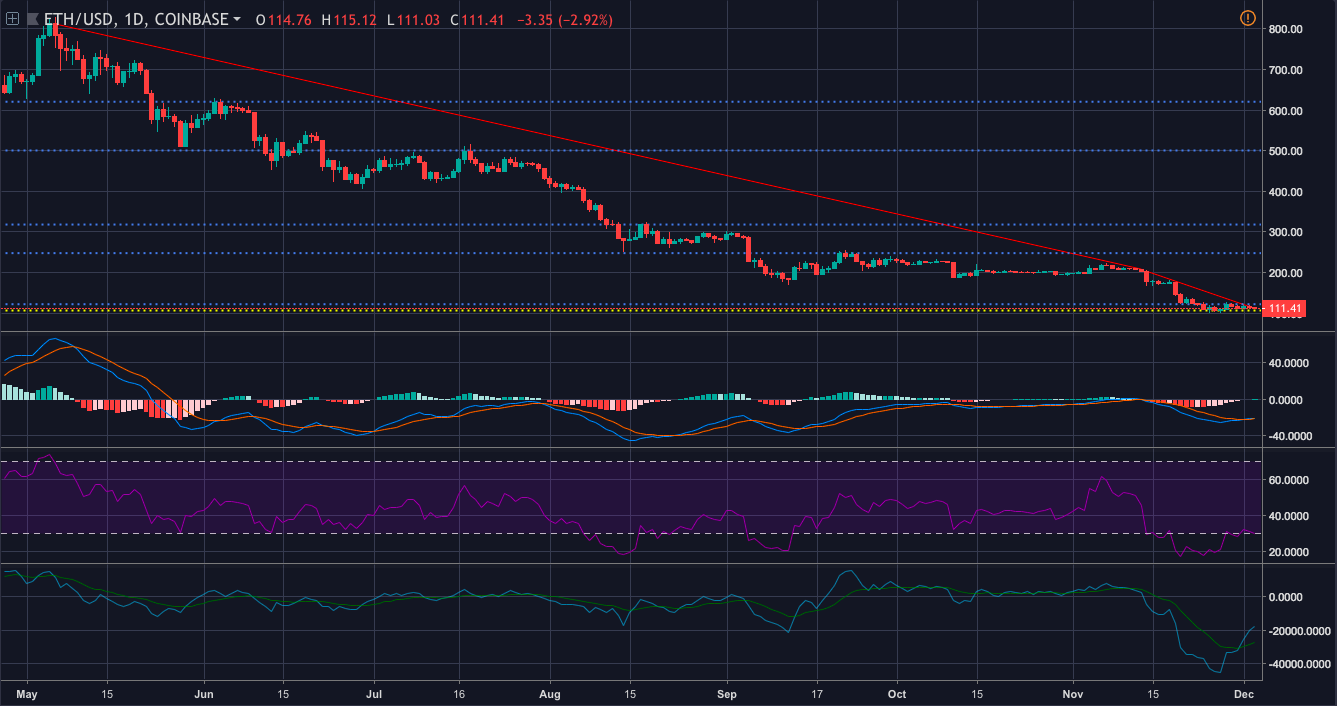
In the one-day chart, the coin shows a downtrend from $812 to $208.77. It also records a sharp downfall from $203.20 to $116.82. The coin has an immediate resistance level at $122.16 and a strong resistance level at $247.88. The coin has discovered a strong support ground at $1o6.67.
Klinger Oscillator is predicting a bullish wave as the reading line has made a crossover to take the road upward.
MACD is also on the same page as the moving average line has made a bullish crossover.
RSI is showing that buying pressure and selling pressure are evening out each other.
Conclusion
The coin shows its support for the bull with the help of the Klinger Oscillator and MACD from the one-day. It also shows its support to the bear with the help of Parabolic SAR and CMF from the one-hour chart.


Article comments