Ethereum [ETH/USD] Technical Analysis: Bear to stomp coin to death?
![Ethereum [ETH/USD] Technical Analysis: Bear to stomp coin to death?](https://coinhub.news/img/51/51414e46e2ef47d91586994a23f684e6_730_522.webp)
Ethereum [ETH], the third biggest cryptocurrency by market cap that sacrificed its second position to XRP has plunged to its May 2017 price. The coin took a free fall with all the other cryptocurrencies such as Bitcoin [BTC], XRP, Litecoin [LTC] and Monero [XMR], earlier today.
According to CoinMarketCap, at press time, Ethereum is trading at $124.87 with a market cap of $12.9 billion. The coin has a trading volume of $2.03 billion and has plummeted by 6.51%.
1 hour:
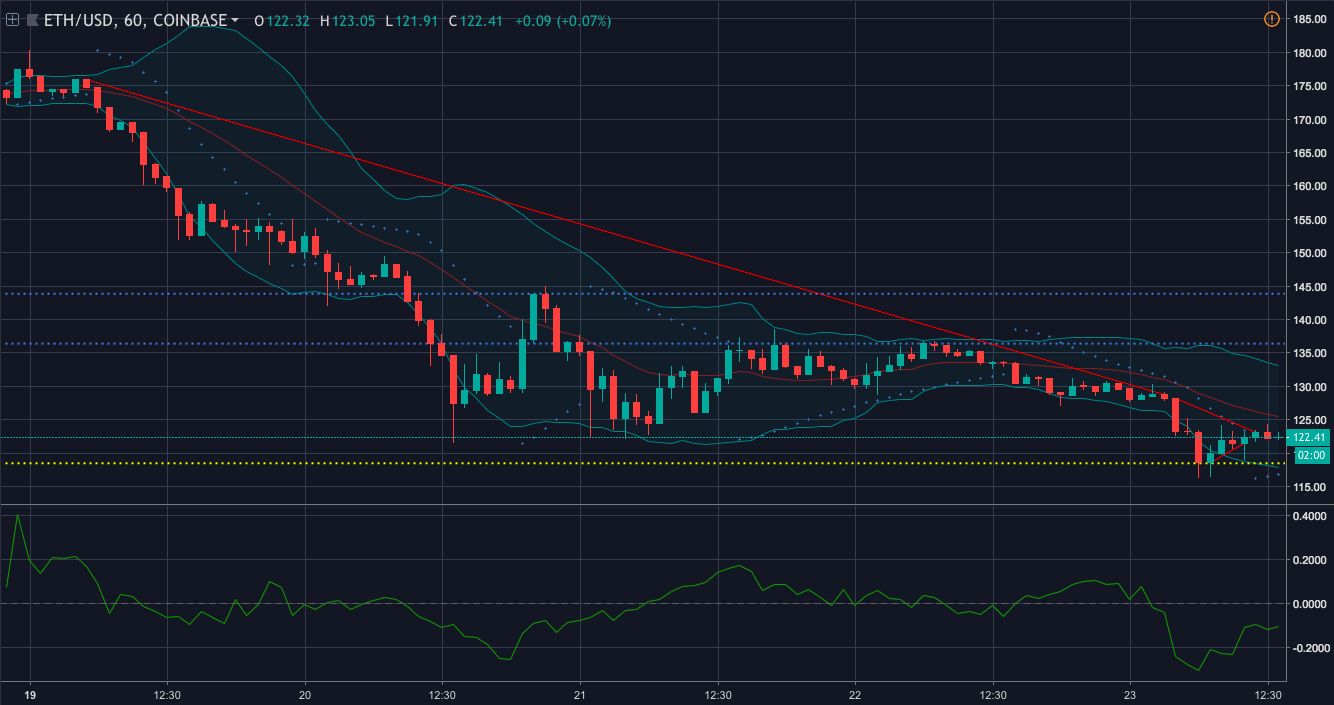
In the one-hour chart, the cryptocurrency pictures a downtrend from $175.90 to $128.22. It further slipped down to $123.13. The coin has a short uptrend from $118.56 to $121.48. It has an immediate resistance at $136.40 and a strong resistance at $136.40. The third-biggest cryptocurrency has a strong support at $118.50.
Parabolic SAR pictures the dots aligned below the candlesticks, indicating a bull market.
The Chaikin Money Flow line is below the zero line as the money is flowing out of the market, showing that the bear’s grip of the coin is strong.
Bollinger Bands indicates that the bands are starting to part from each other, predicting a volatile market.
1 day:
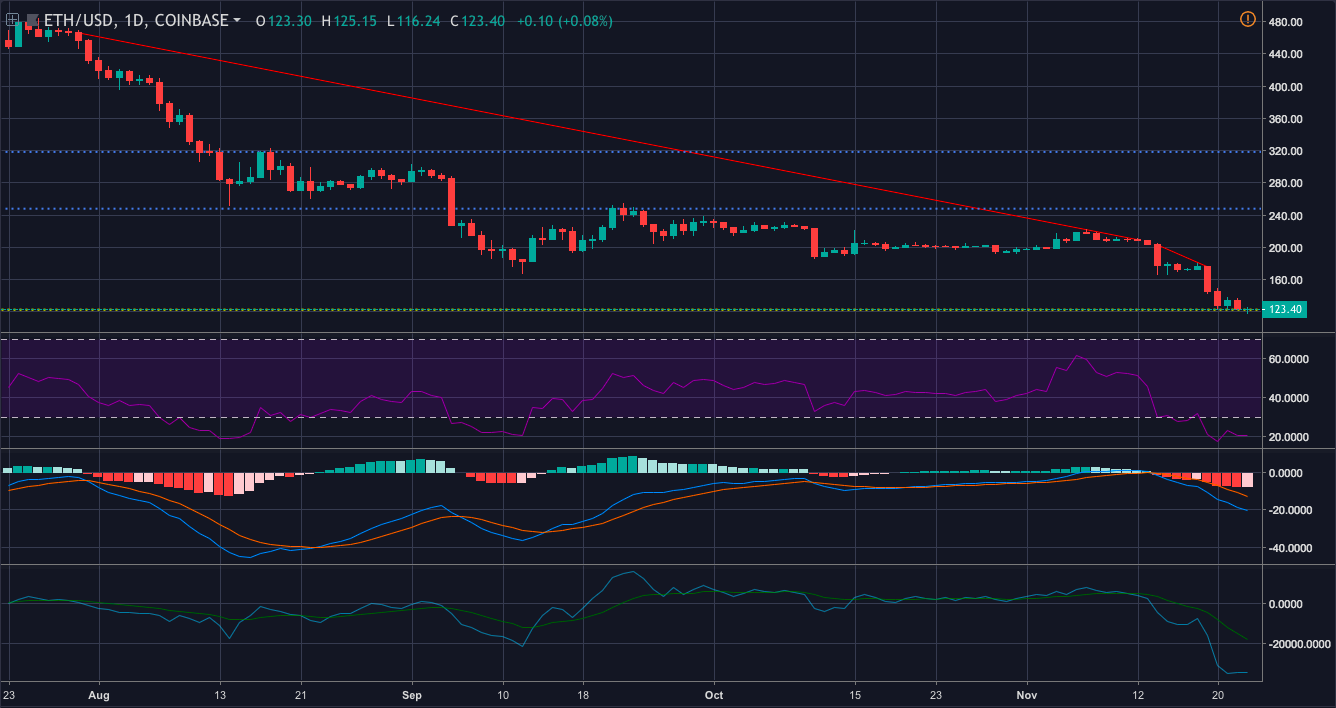
In the one-day chart, the cryptocurrency has a downtrend from $466.01 to $209.72. The coin does not have a significant uptrend. It has an immediate resistance at $248.01 and a strong resistance at $318.40. The coin has a support $248.01 which was set in the the month of May last year.
The RSI shows that the selling pressure for the coin is more than the buying pressure, indicating a bearish weather.
MACD agrees with the RSI, as the indicator is also predicting a bearish weather as the moving average line is below the signal line.
Klinger Oscillator is also showing that the market is going to crown the bear as the reading line is below the signal line.
Conclusion:
The bear has decided not to leave the market and especially Ethereum. It is backed by CMF from the one-hour chart and the RSI, MACD and Klinger Oscillator from the one-day chart.


Article comments