Ethereum [ETH/USD] Technical Analysis: Bear readies for its second attack in the long-term
![Ethereum [ETH/USD] Technical Analysis: Bear readies for its second attack in the long-term](https://coinhub.news/img/77/774a7c3b01bff1f087363e43b6551b06_730_522.webp)
The cryptocurrency market had experienced a major dump within the span of an hour yesterday, with Ether [ETH], which is the native token of the Ethereum blockchain and is right below the top coin, seeing a massive slump.
At the time of writing, the token was trading at a price of $197.45, with a market cap of $20.3 billion. ETH was showing a price plunge of 3.45% in the last 24 hours, with a trading volume of $1.48 billion.
1-hour:
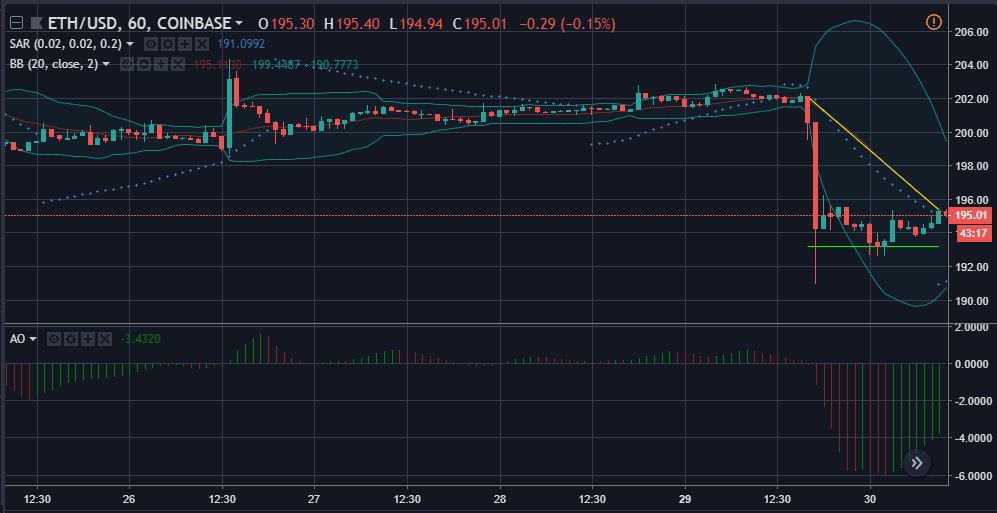
In this timeframe, the downward trend line is ranging from $202.12 to $195.27. The support level is currently set at $193.19 in a more immediate scenario. The lines are clearly depicting a descending triangle, leading to a downtrend in the Ethereum price.
The Parabolic SAR is bullish on the Ether market as the dots are aligned directly below the candles. The indicator is currently uplifting the market prediction by siding with the bull.
The Bollinger Bands previously swelled and widened its neck to give way to price fluctuation, but is returning back to its normal pattern by starting to close on each other. However, there is still possibility of an increased volatility in the ETH prices as the bands have not narrowed down at the moment.
The Awesome Oscillator is highly positive and is flashing green at the ETH price trend. The bull seems to have pleased the indicat0r to predict a positive future for the coin.
1-day:
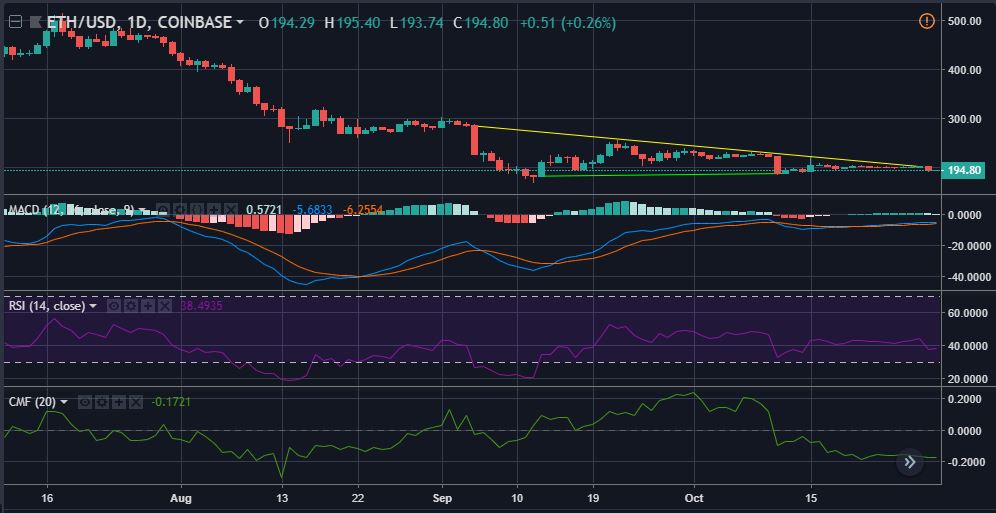
In the longer scenario of the ETH candlesticks, the trendlines are stretching from $285.52 to $202.54 [downtrend] and $182.68 to $188.42 [uptrend]. There is still a gap between the immediate support and resistance levels, eliminating the possibility of a foreseeable trend breakout.
The MACD made a slightly bullish crossover by the signal and is currently traveling just above the line. This is indicative of a positive feedback for the Ether price, but does not depict any major uptrend as of now.
The RSI is in the bearish zone, but has denied commenting on the forthcoming scenario. The indicator is moving sideways, reflecting a horizontal market trend.
The Chaikin Money Flow is also bearish on the coin. It is currently moving way below the 0-mark, suggestive of a negative market trend.
Conclusion
In the short-term, the Ether market has witnessed a positive prediction. However, indicators under a longer scenari0 do not see much potential in the Ethereum market and have predicted it to be slightly bearish, with the hint of a sideways movement.


Article comments