Ethereum [ETH/USD] Technical Analysis: Bear prevails over the bull
![Ethereum [ETH/USD] Technical Analysis: Bear prevails over the bull](https://coinhub.news/img/85/85ba0299d60370922c6d02d9ce8f738b_730_522.webp)
Ethereum [ETH], the third-largest cryptocurrency by market cap, continues to bleed in the market because of the bear’s attack. It is not the only coin to be injured because of the winter animal, other cryptocurrencies such as Bitcoin [BTC], XRP, Bitcoin Cash [BCHABC], and Litecoin [LTC] have joined the club. Additionally, the cryptocurrency settled below the $100 mark for the first time since its all-time high.
According to CoinMarketCap, at press time, Ethereum was trading at $85.88 with a market cap of $8.9 billion. The coin has a trading volume of $2.3 billion and has plunged by more than 25% in the past seven days.
1 hour:
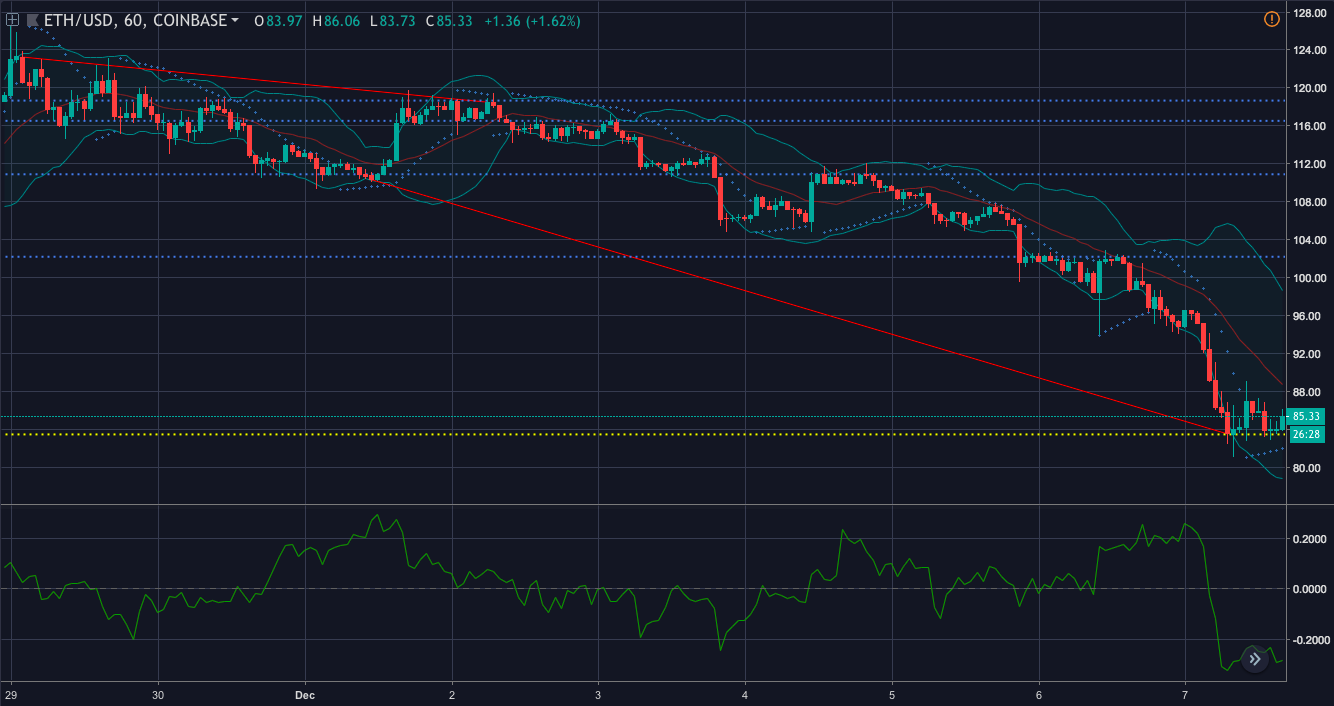
In the one hour chart, the coin shows a downtrend from $123.25 to $228.49. It also demonstrates another sharp decline from $110.32 to $83.50. The cryptocurrency has an immediate resistance at $102.19 and strong resistance at $110.89. The support for the coin is set at $83.45.
Parabolic SAR is currently predicting a bullish weather as the dots have aligned below the candlesticks with the intention of pushing the coin up.
Bollinger Bands have expanded in the market, forecasting a more volatile market for the cryptocurrency.
Chaikin Money Flow, however, is showing a bearish wave as the line is below the zero mark, indicating that the money is flowing outside the market.
1 day:
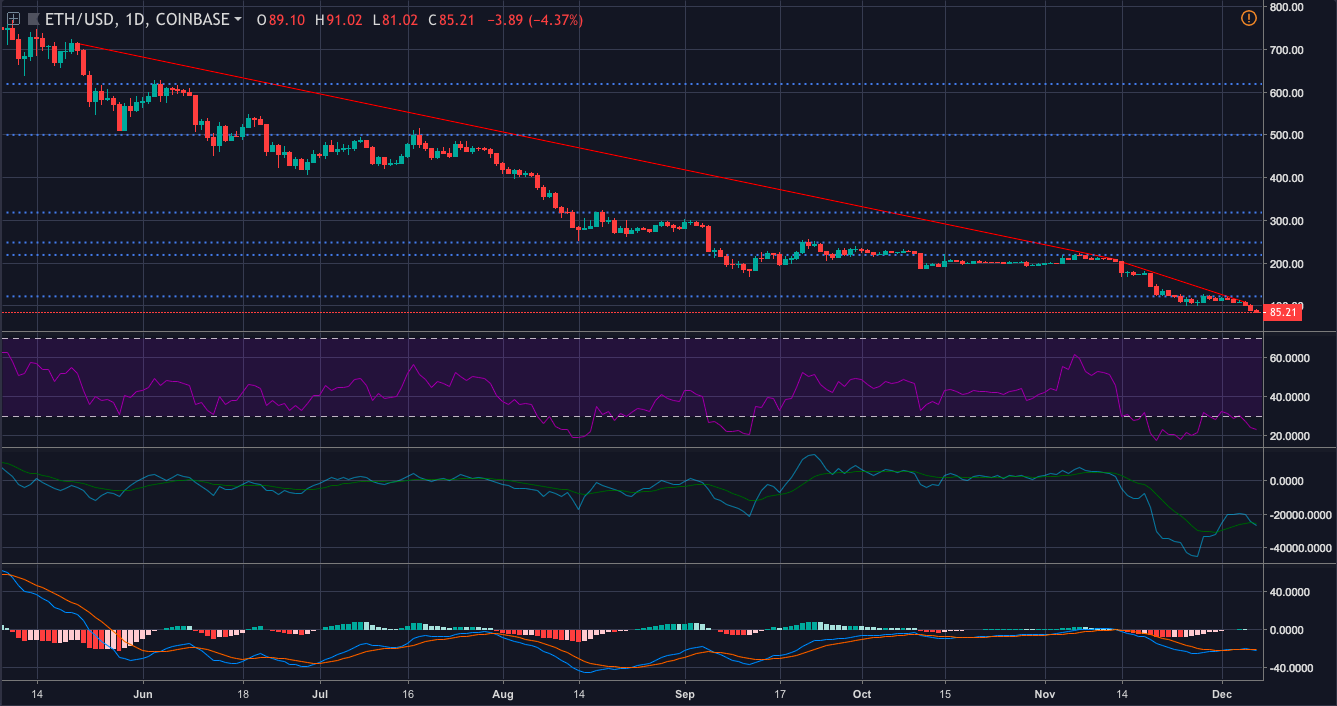
In the one-day chart, the cryptocurrency records a downtrend from $714 to $208.77. It also shows a steep fall from $203.20 to $108.61. The immediate resistance for the coin is at $122.16 and the strong resistance is set at $219.16.
MACD is predicting a bearish wave as the moving average line has made a crossover with the intention of going downhill.
Klinger Oscillator is also forecasting a bearish rule as the reading line has made a crossover only to take the direction south.
RSI is also on the same page as it demonstrates that the selling pressure for the coin is more than the buying pressure.
Conclusion:
The bear has gained complete control over the coin as indicated by MACD, Klinger Oscillator and RSI from the one-day chart, and CMF from the one-hour chart. The bull has not given up over the coin and is marching forward with the help of Parabolic SAR from the one-hour chart.


Article comments