Ethereum [ETH/USD] Technical Analysis: Bear assembles forces for war against green-headed bulls
![Ethereum [ETH/USD] Technical Analysis: Bear assembles forces for war against green-headed bulls](https://coinhub.news/img/73/7354f8df7aff36142358c0df40bc68c0_730_522.webp)
Ethereum [ETH], the third-biggest cryptocurrency by market cap, has blessed its investors by going all green today. Unlike the previous two weeks, this week seems to be brighter for the coin as it has seen a massive surge in terms of price.
According to CoinMarketCap, at press time, Ethereum was trading at $115.16 with a market cap of $11.91 billion. The cryptocurrency had a trading volume of $2.35 billion and had surged by 8.31% in the past 24 hours.
1-hour
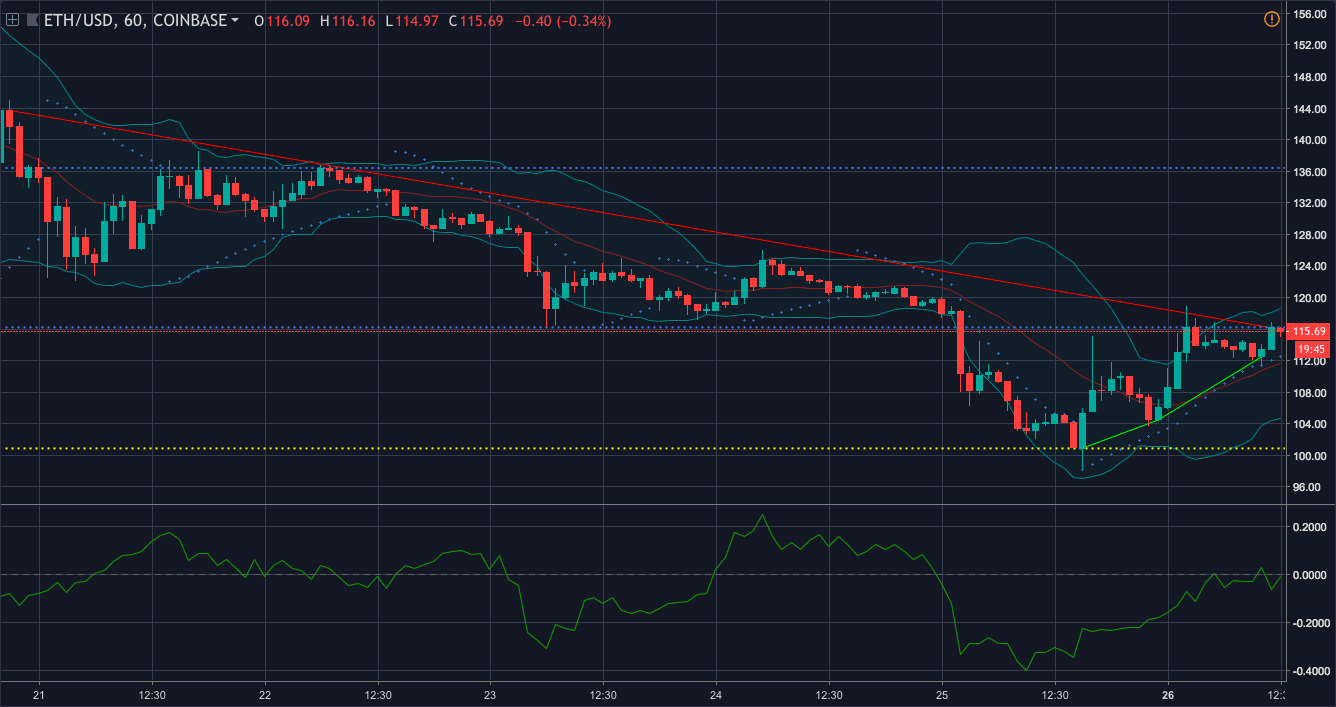
In the one-hour chart, the cryptocurrency shows a downtrend from $143.69 to $116.17. The chart also demonstrates an uptrend from $100.93 to $104.49, and further upwards to settle at $112.50. It has an immediate resistance at $116.22 and a strong resistance at $136.41. The third-biggest currency has a strong support at $100.88.
Parabolic SAR is currently indicating a bullish wave as the dots have aligned below the candlesticks, pushing the prices up.
Bollinger Bands are picturing the bands parting from each other, forecasting a volatile market for the coin.
Chaikin Money Flow, at present, is depicting that the coin is still held by the bear. However, it also pictures the line going uphill, indicating that money is starting to flow into the market.
1-day:
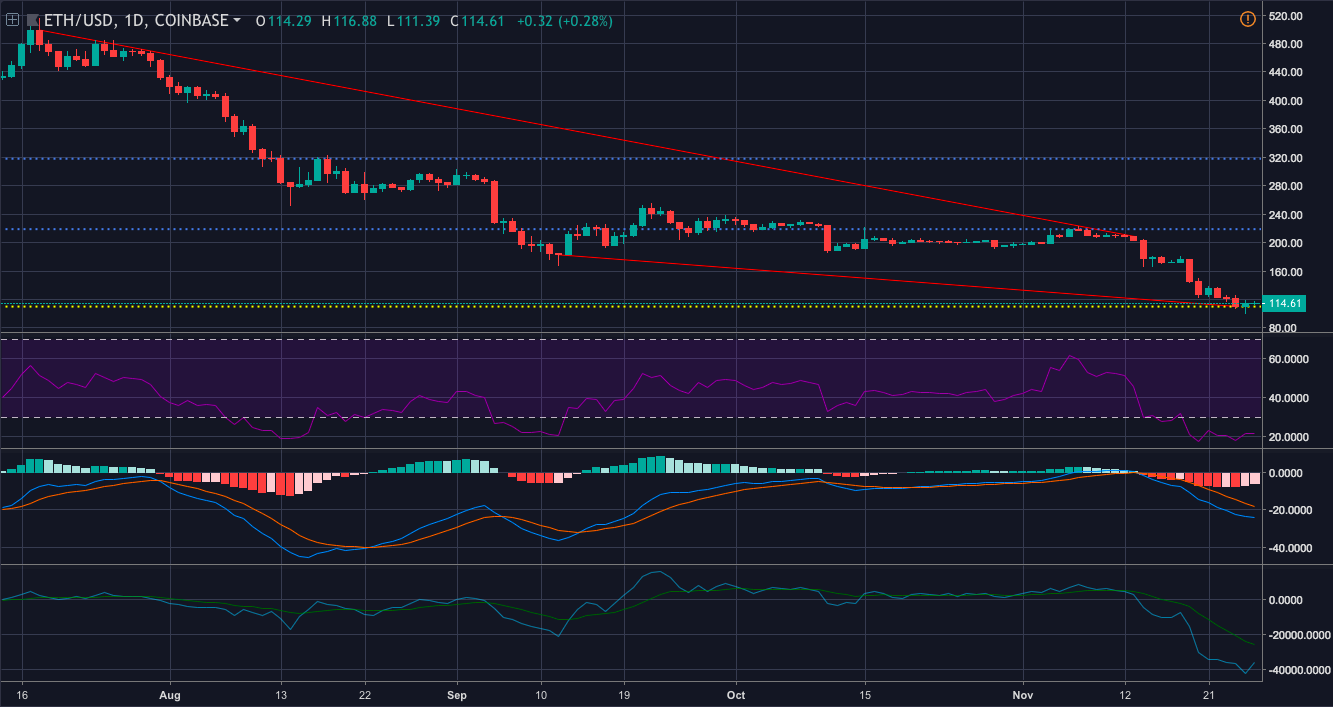
In the one-day chart, the coin shows a sharp downtrend from $499.01 to $208.77. The chart pictures another steep downtrend from $182.79 to $110.16. It has an immediate resistance at $218.90 and a strong resistance at $317.98. The coin has an immediate support at $109.97.
RSI shows that the coin is still in the bear’s grip as the selling pressure for the coin is more than the buying pressure.
MACD indicator depicts that the moving average made its cross-over with the signal line long ago, only to climb down the hill.
Klinger Oscillator also has taken the same path as the MACD and is bearish.
Conclusion
Despite the coin glowing green at press time, the bull’s side is overpowered by the bear’s side. The bear has the allegiance of MACD, RSI, and Klinger Oscillator from the one-day chart and the CMF’s from the one-hour chart. However, the bull is supported by the Parabolic SAR from the one-day chart.


Article comments