Ethereum [ETH] Technical Analysis: Cryptocurrencies drown in red as bears complete their siege
![Ethereum [ETH] Technical Analysis: Cryptocurrencies drown in red as bears complete their siege](https://coinhub.news/img/8a/8ab0f0eb63cf7cd62de0466ad4f401de_730_522.webp)
Ethereum [ETH] has failed to hold its position when XRP overtook it a few weeks back and it doesn’t look like it is going to come back up anytime soon. At the time of writing, Ethereum was trading at $133.74, with a market cap of $14.11 billion and had fallen by a massive 35% in a seven-day interval.
1-hour
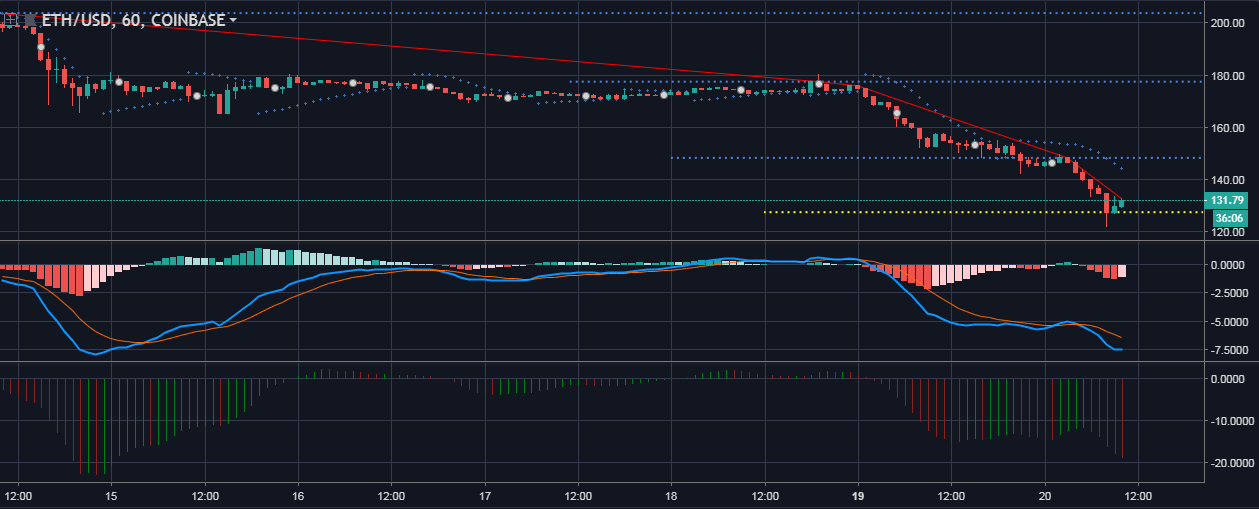
Uptrends of all cryptocurrencies have vanished, leaving no sign at all and the downtrend extends from $203.77 to $132.53. Ethereum prices have nosedived and have created a support way below the $150 line, i.e., at $127.40. Resistance points can be seen hanging at $148.22, $177.45 and $203.77.
The Parabolic SAR markers are showing a bearish trend as the distance between the markers and the candles are increasing daily.
The MACD line witnessed a bearish crossover on November 18 and it didn’t seem to stop there as it kept tumbling. The histogram for MACD shows red bars hanging below the zero line, indicating a downtrend in progression.
The Awesome Oscillator shows a transition of green spikes to red spikes, indicating that the price is decreasing and a possible bearish trend.
1-day
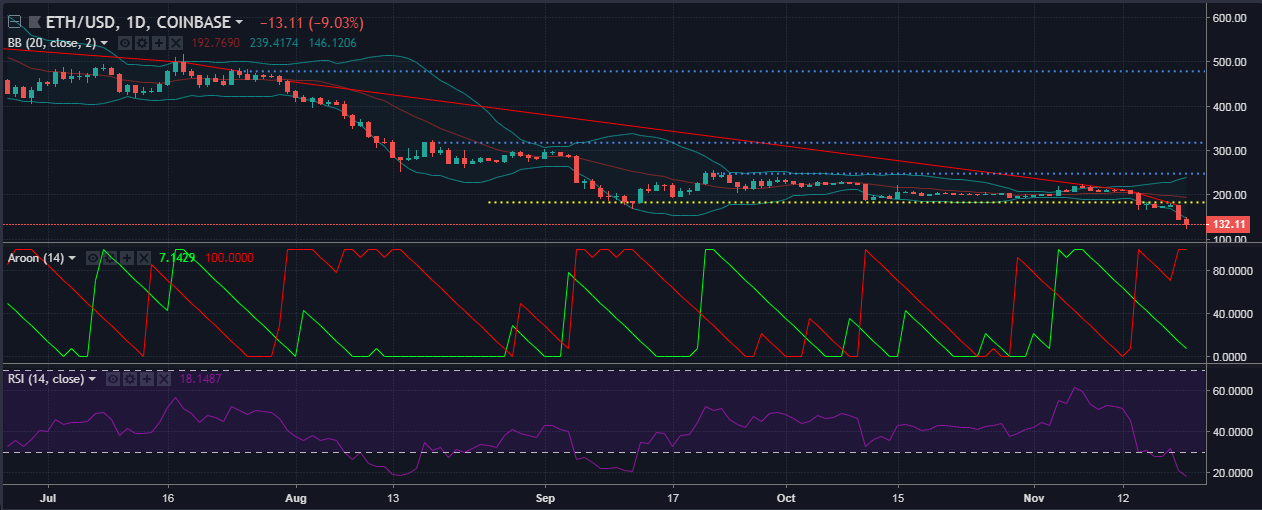
The prices for Ethereum in the long-term look as dire as in the one-hour time frame because the downtrend ranges wide, starting from $536 to $175.90. Expecting an uptrend here seems like a pipe dream. The prices have broken support at $182.79 and have dipped further down. The resistance points are set up at $247.76, $317.55 and $478.79.
The Bollinger bands have been in a squeezed state for more than a month and are starting to see a little bit of expansion. The prices have fallen below the simple moving average and have also broken the lower band, indicating an oversold market.
The Aroon up line is heading downwards, while the Aroon up line has hit the 100 line. Aroon indicator shows a strong downtrend in progress.
The RSI shows the same as MACD and the Aroon, as RSI has fallen below the oversold line.
Conclusion
The one-day and the one-hour charts all indicate a dire environment for Ethereum as they point at a bearish market.


Article comments