Ethereum [ETH] Technical Analysis: Bulls to take over the bear bestrode market
![Ethereum [ETH] Technical Analysis: Bulls to take over the bear bestrode market](https://coinhub.news/img/09/091dc99c6a0951e98c1d19ad77b98059_730_522.webp)
Sunday morning witnessed the delighted journey of cryptocurrency market towards the bullish side, wherein, most of the coins have shown an upward momentum in the past 24 hours. Ethereum [ETH] continues to stay at the 3rd position by market cap even after 3 weeks since it faced the utmost defeat by XRP.
At the time of writing, ETH is trading at $117.63 with a market cap of $12.18 billion. The cryptocurrency has surged by 4.21% in the past 24 hours with the highest volume to be seen on exchanges such as OEX, RightBTC etc. The 7 days statistics of Ethereum has also shown an impressive progress with a 9.33% hike, according to CoinMarketCap.
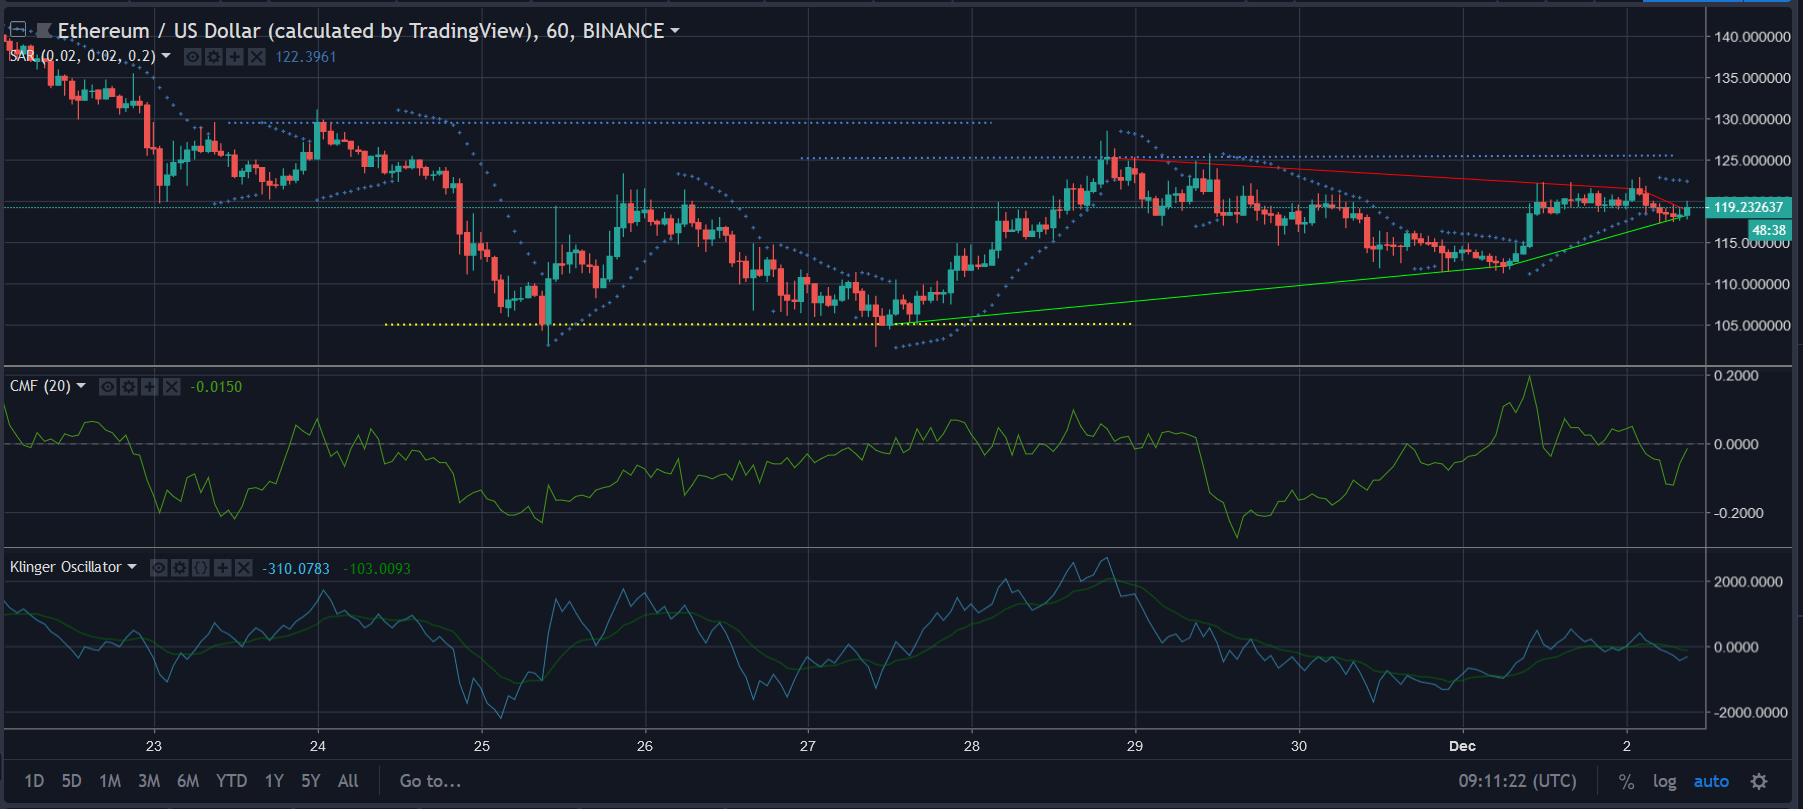
The Parabolic SAR is currently forming the dots right above the candlesticks, indicating that it is the beginning of a bear trend. This comes right after a strong bullish signal indicated by SAR previously.
The Chaikin Money Flow is currently below the zero line, which is gradually moving upwards indicating that the inflow of money in Ethereum market has increased.
Klinger Oscillator has taken a bearish crossover a few hours back, however, it can be noticed that the reading line is depicting a reversal and moving upwards currently.
24 hours:
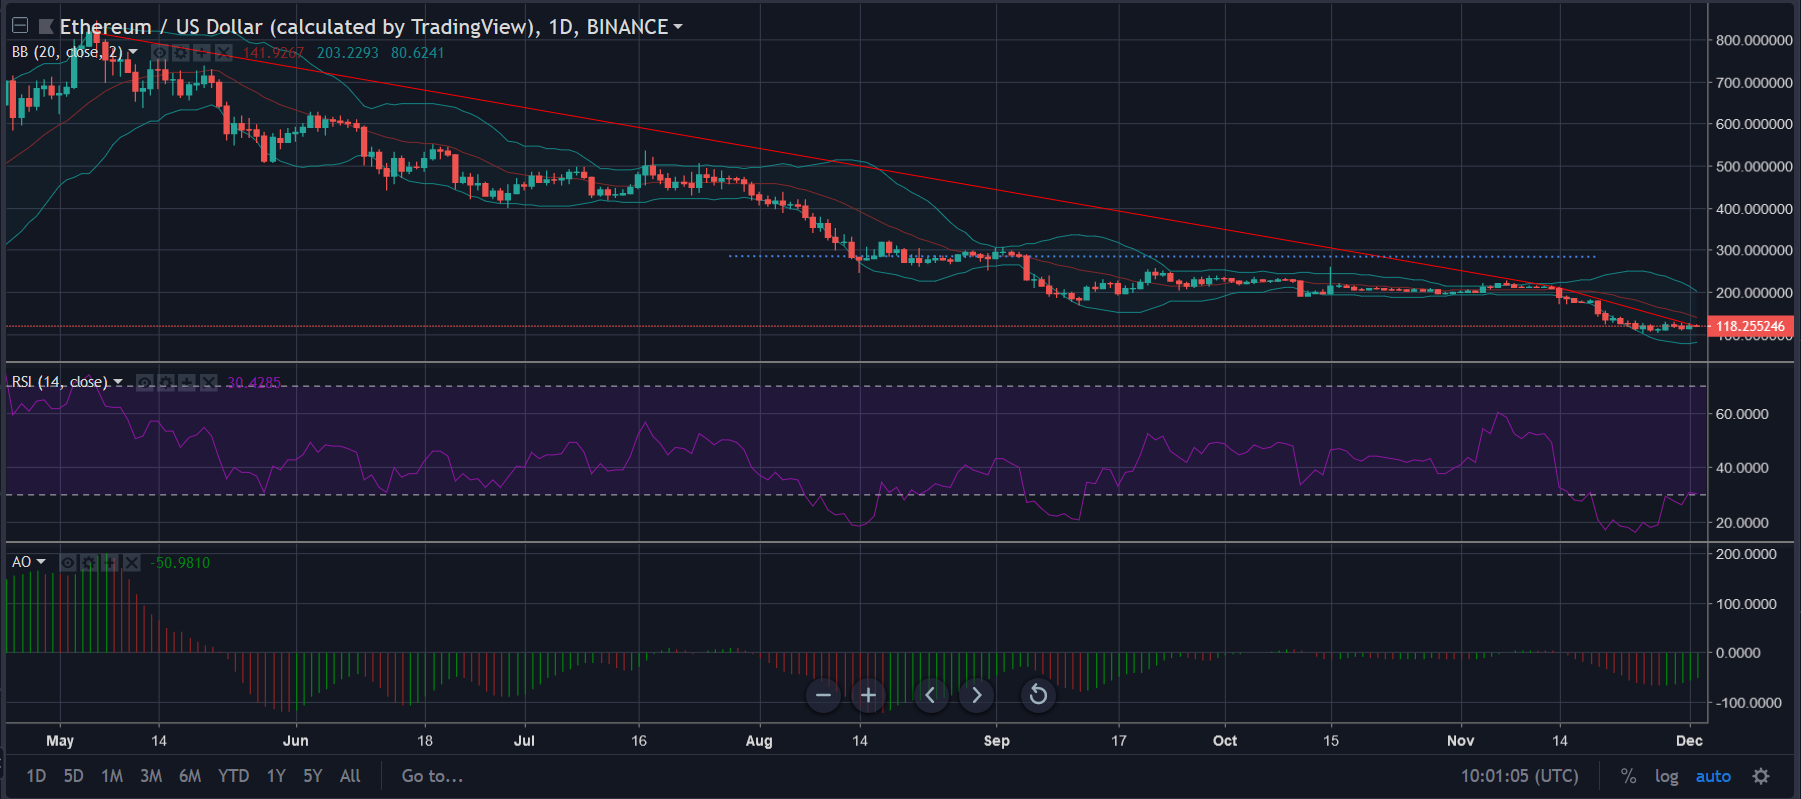
The daily candlesticks of Ethereum [ETH] are currently experiencing a strong downtrend ranging from $821.7 – $211.4 – $122.5. The recent resistance point for the cryptocurrency is set at $286.58.
The Bollinger Bands is currently expanding indicating that there is a high chance of increased volatility in the Ethereum market.
The Relative Strength Index [RSI], was hit majorly and the price had brought it below the oversold line. However, the indicator is currently moving back to the RSI zone, depicting that the selling pressure has reduced in this time frame.
The Awesome Oscillator shows a transition to the green signal indicating that there will be a bullish trend in the future.
Conclusion:
In both the timeframes, most of the indicators are demonstrating the beginning of a bull run for Ethereum. The diverging Bollinger Bands are giving more space for the candlesticks to form trend reversal patterns on a long run.


Article comments