EOS Technical Analysis: Price to see an upward momentum with short-term bull run

November 12 witnessed another staggering moment of the crypto market when EOS was overtaken by Stellar [XLM]. During the last week of April 2018, EOS had grabbed the fifth position on the cryptocurrency market list and has been holding its position constantly since then. However, the cryptocurrency has been moved one position below by its market cap today.
At the time of writing, EOS is trading at $5.39 with a market cap of $4.8 billion. The coin has witnessed an insignificant gain of 1.6% in the past 24 hours.
1-hour:
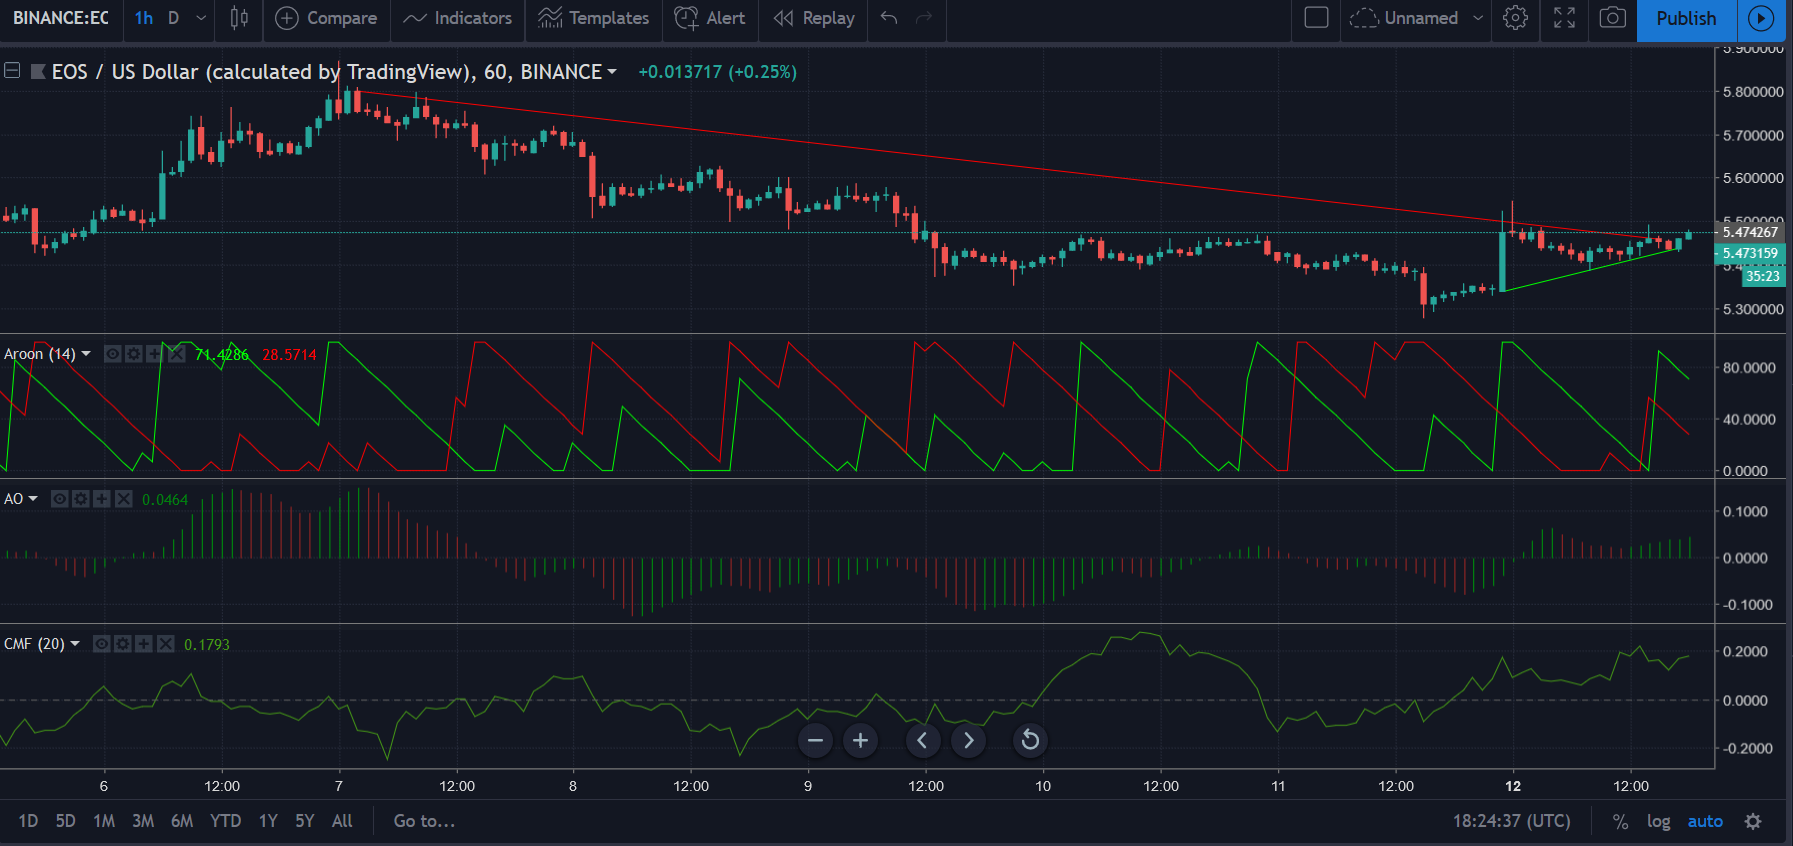
In the one-hour chart of EOS, we can see an uptrend from $5.33 to $5.44 and a dominating downtrend extending from $5.78 to $5.46.
The Aroon Indicator is demonstrating an uptrend with Aroon Up line crossing the Aroon Down line. However, a slight downtrend is also being experienced during this timeline as the Up line moving downwards.
The Awesome Oscillator stays bullish as the histogram displays green lines forming above the zero line.
Chaikin Money Flow graph is above the zero line, indicating the inflow of an ample amount of money.
1-day:
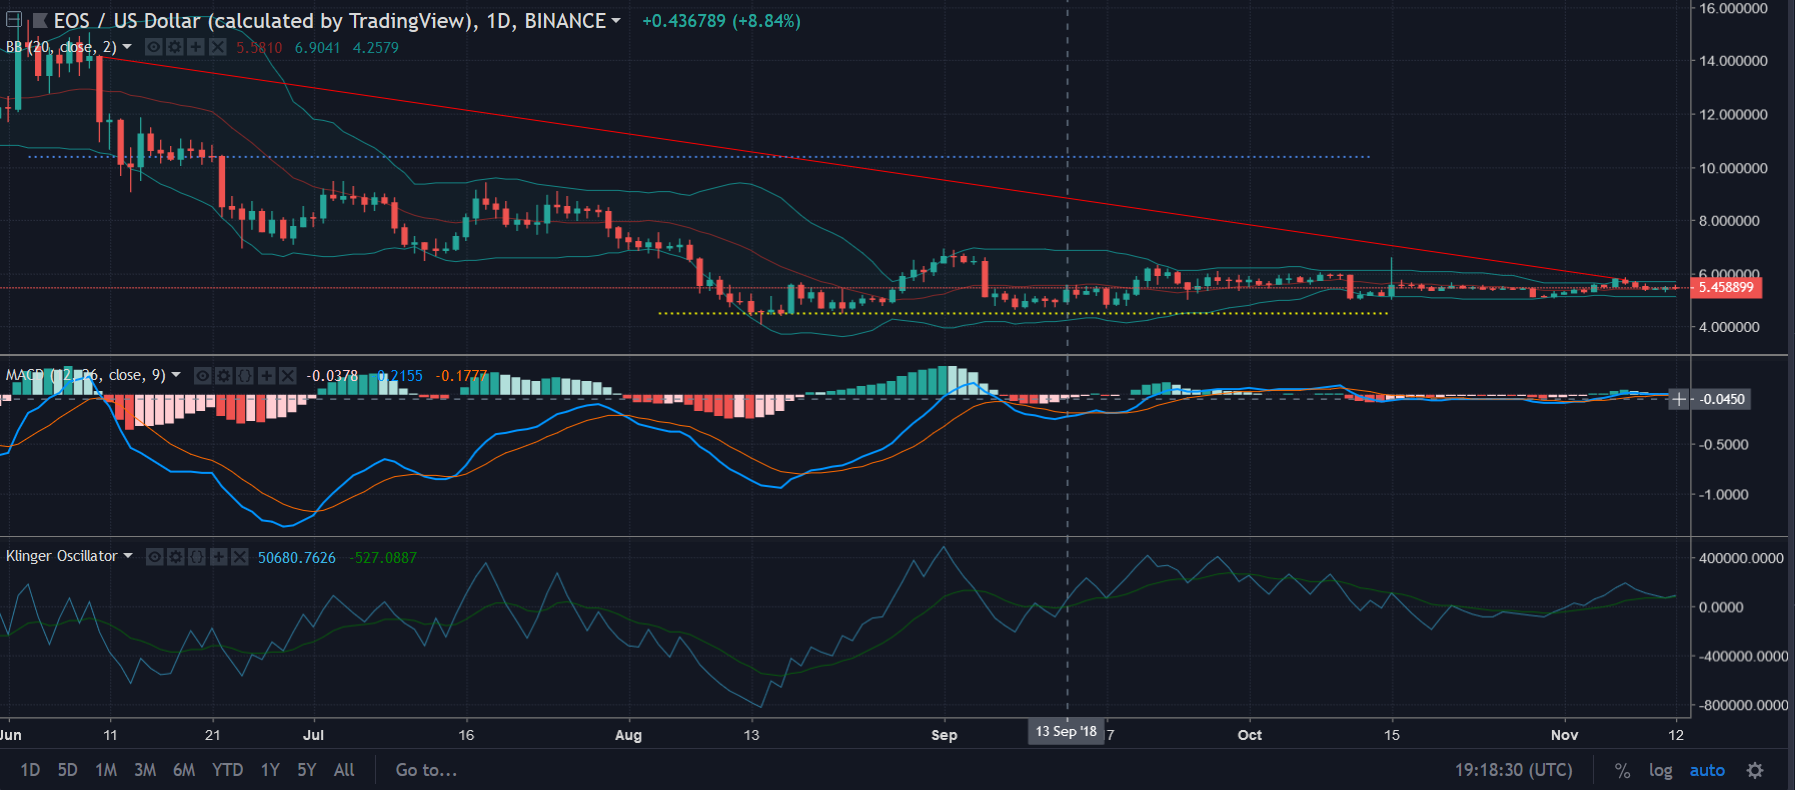
The one-day chart of EOS shows a downtrend from $14.13 to $5.7 and the price has set a resistance level at $10.4. The support can be observed at $0.49.
The MACD has shown a slight bullish crossover with the formation of green bars on the histogram.
The Bollinger Bands demonstrate less volatility in the EOS market as it’s forming a narrow path.
Klinger Oscillator has also shown a bullish crossover as the reading line started moving above the signal line.
Conclusion
All the indicators in both the timelines are showing a bullish trend. However, the trend seems to be a short-term upward momentum since none of the indicators demonstrated a strong bullish signal.


Article comments