Cardano [ADA/USD] Technical Analysis: Interim bullish push imminent; bears yet to show mercy on long haul
![Cardano [ADA/USD] Technical Analysis: Interim bullish push imminent; bears yet to show mercy on long haul](https://coinhub.news/img/8a/8a7035b34631a7ecfa5de3bf10c0bec3_730_522.webp)
Cardano [ADA] seems to be getting a bullish push in the short-term, even as the bearish trend in the medium to long-term seems to not fade away. There seems to be no respite from the bear attack in the long-term as the downward trend in price is still going strong.
ADA, the ninth largest cryptocurrency in the world, is currently trading at $0.0759, after going down at -1.19% over the last day. It has a market cap of $1.97 billion, with a 24-hour trade volume of $18.02 million.
1-hour:
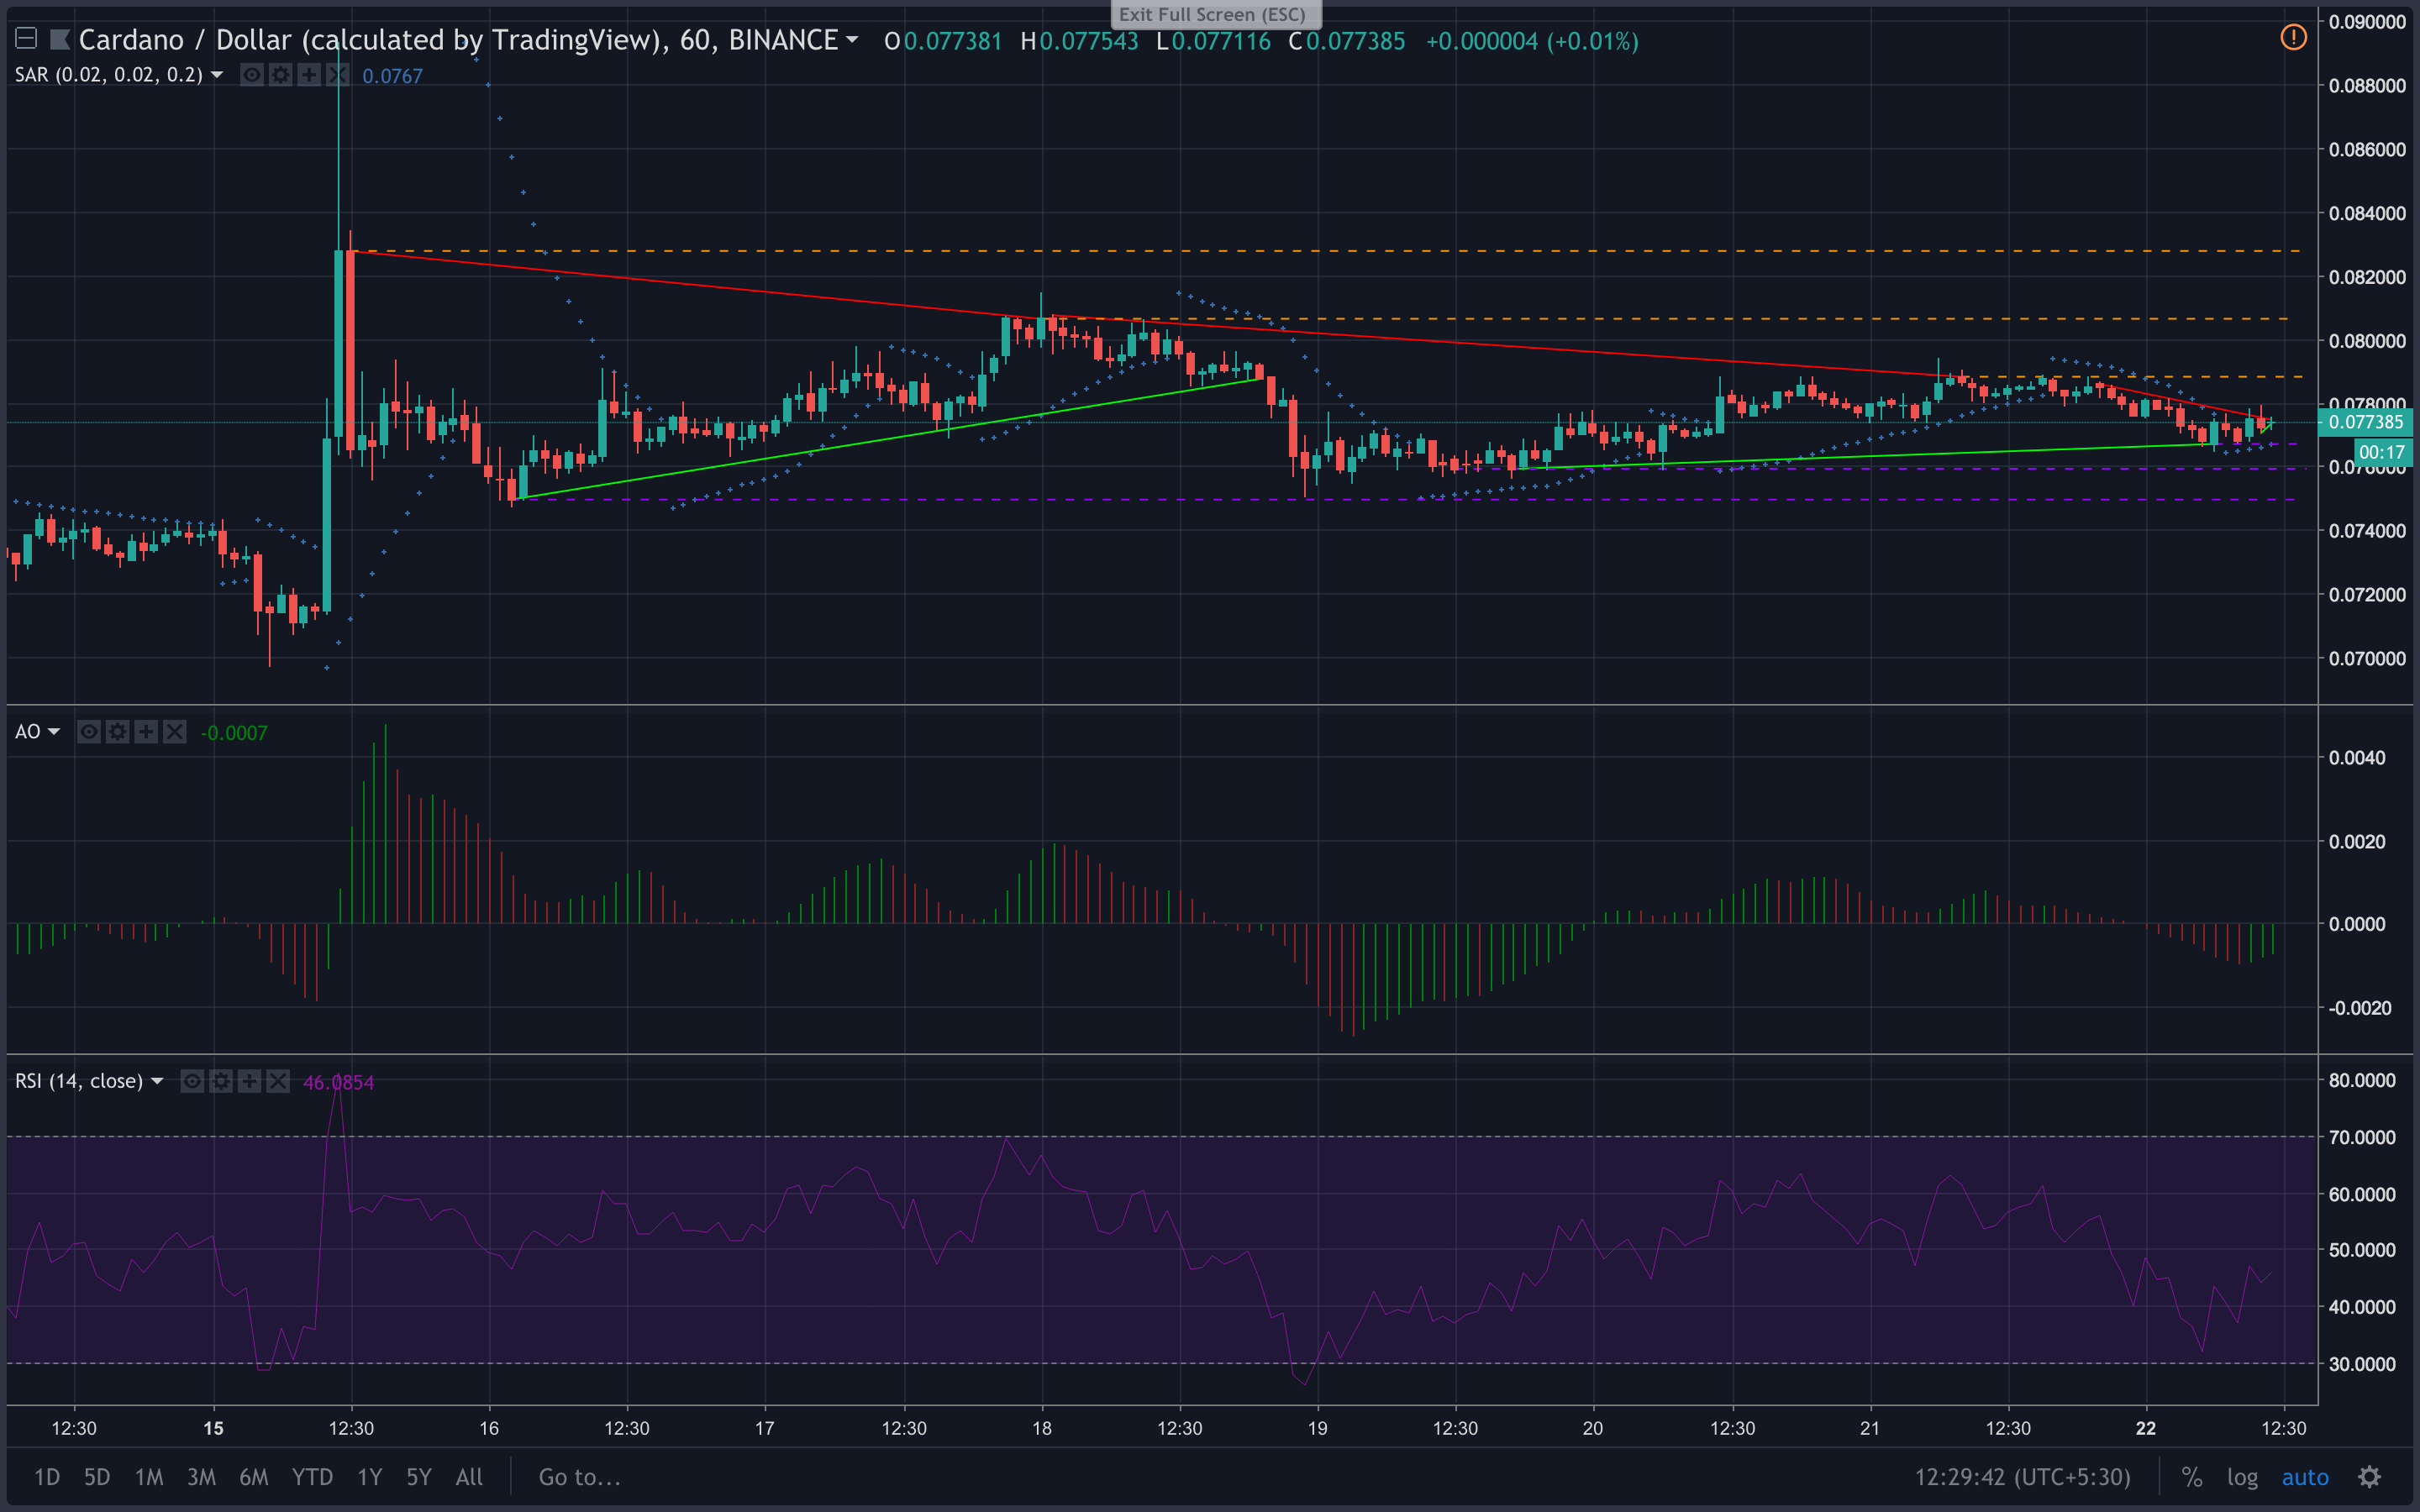
On the one-hour graph, a strong downtrend can be seen from $0.0827 to $0.0806, and then further to $0.0788 between October 15 to October 21, 2018. Another downward movement can be seen from $0.0786 to $0.0774 on October 22, 2018.
An upward drift in prices can be seen from October 16 to October 22, 2018, from $0.0749 to $0.0787. A short-term upward trend was seen on October 22, 2018, from $0.0770 to $0.0773.
The Awesome Oscillator chart shows green bars emerging after a string of red bars. This is a clear indicator of a bullish market.
The Parabolic SAR chart shows the dots aligned under the candlesticks, indicating a bullish market.
The RSI chart shows the token recovering from an oversold position slowly, with the buying and selling pressure evening each other out.
1-day:
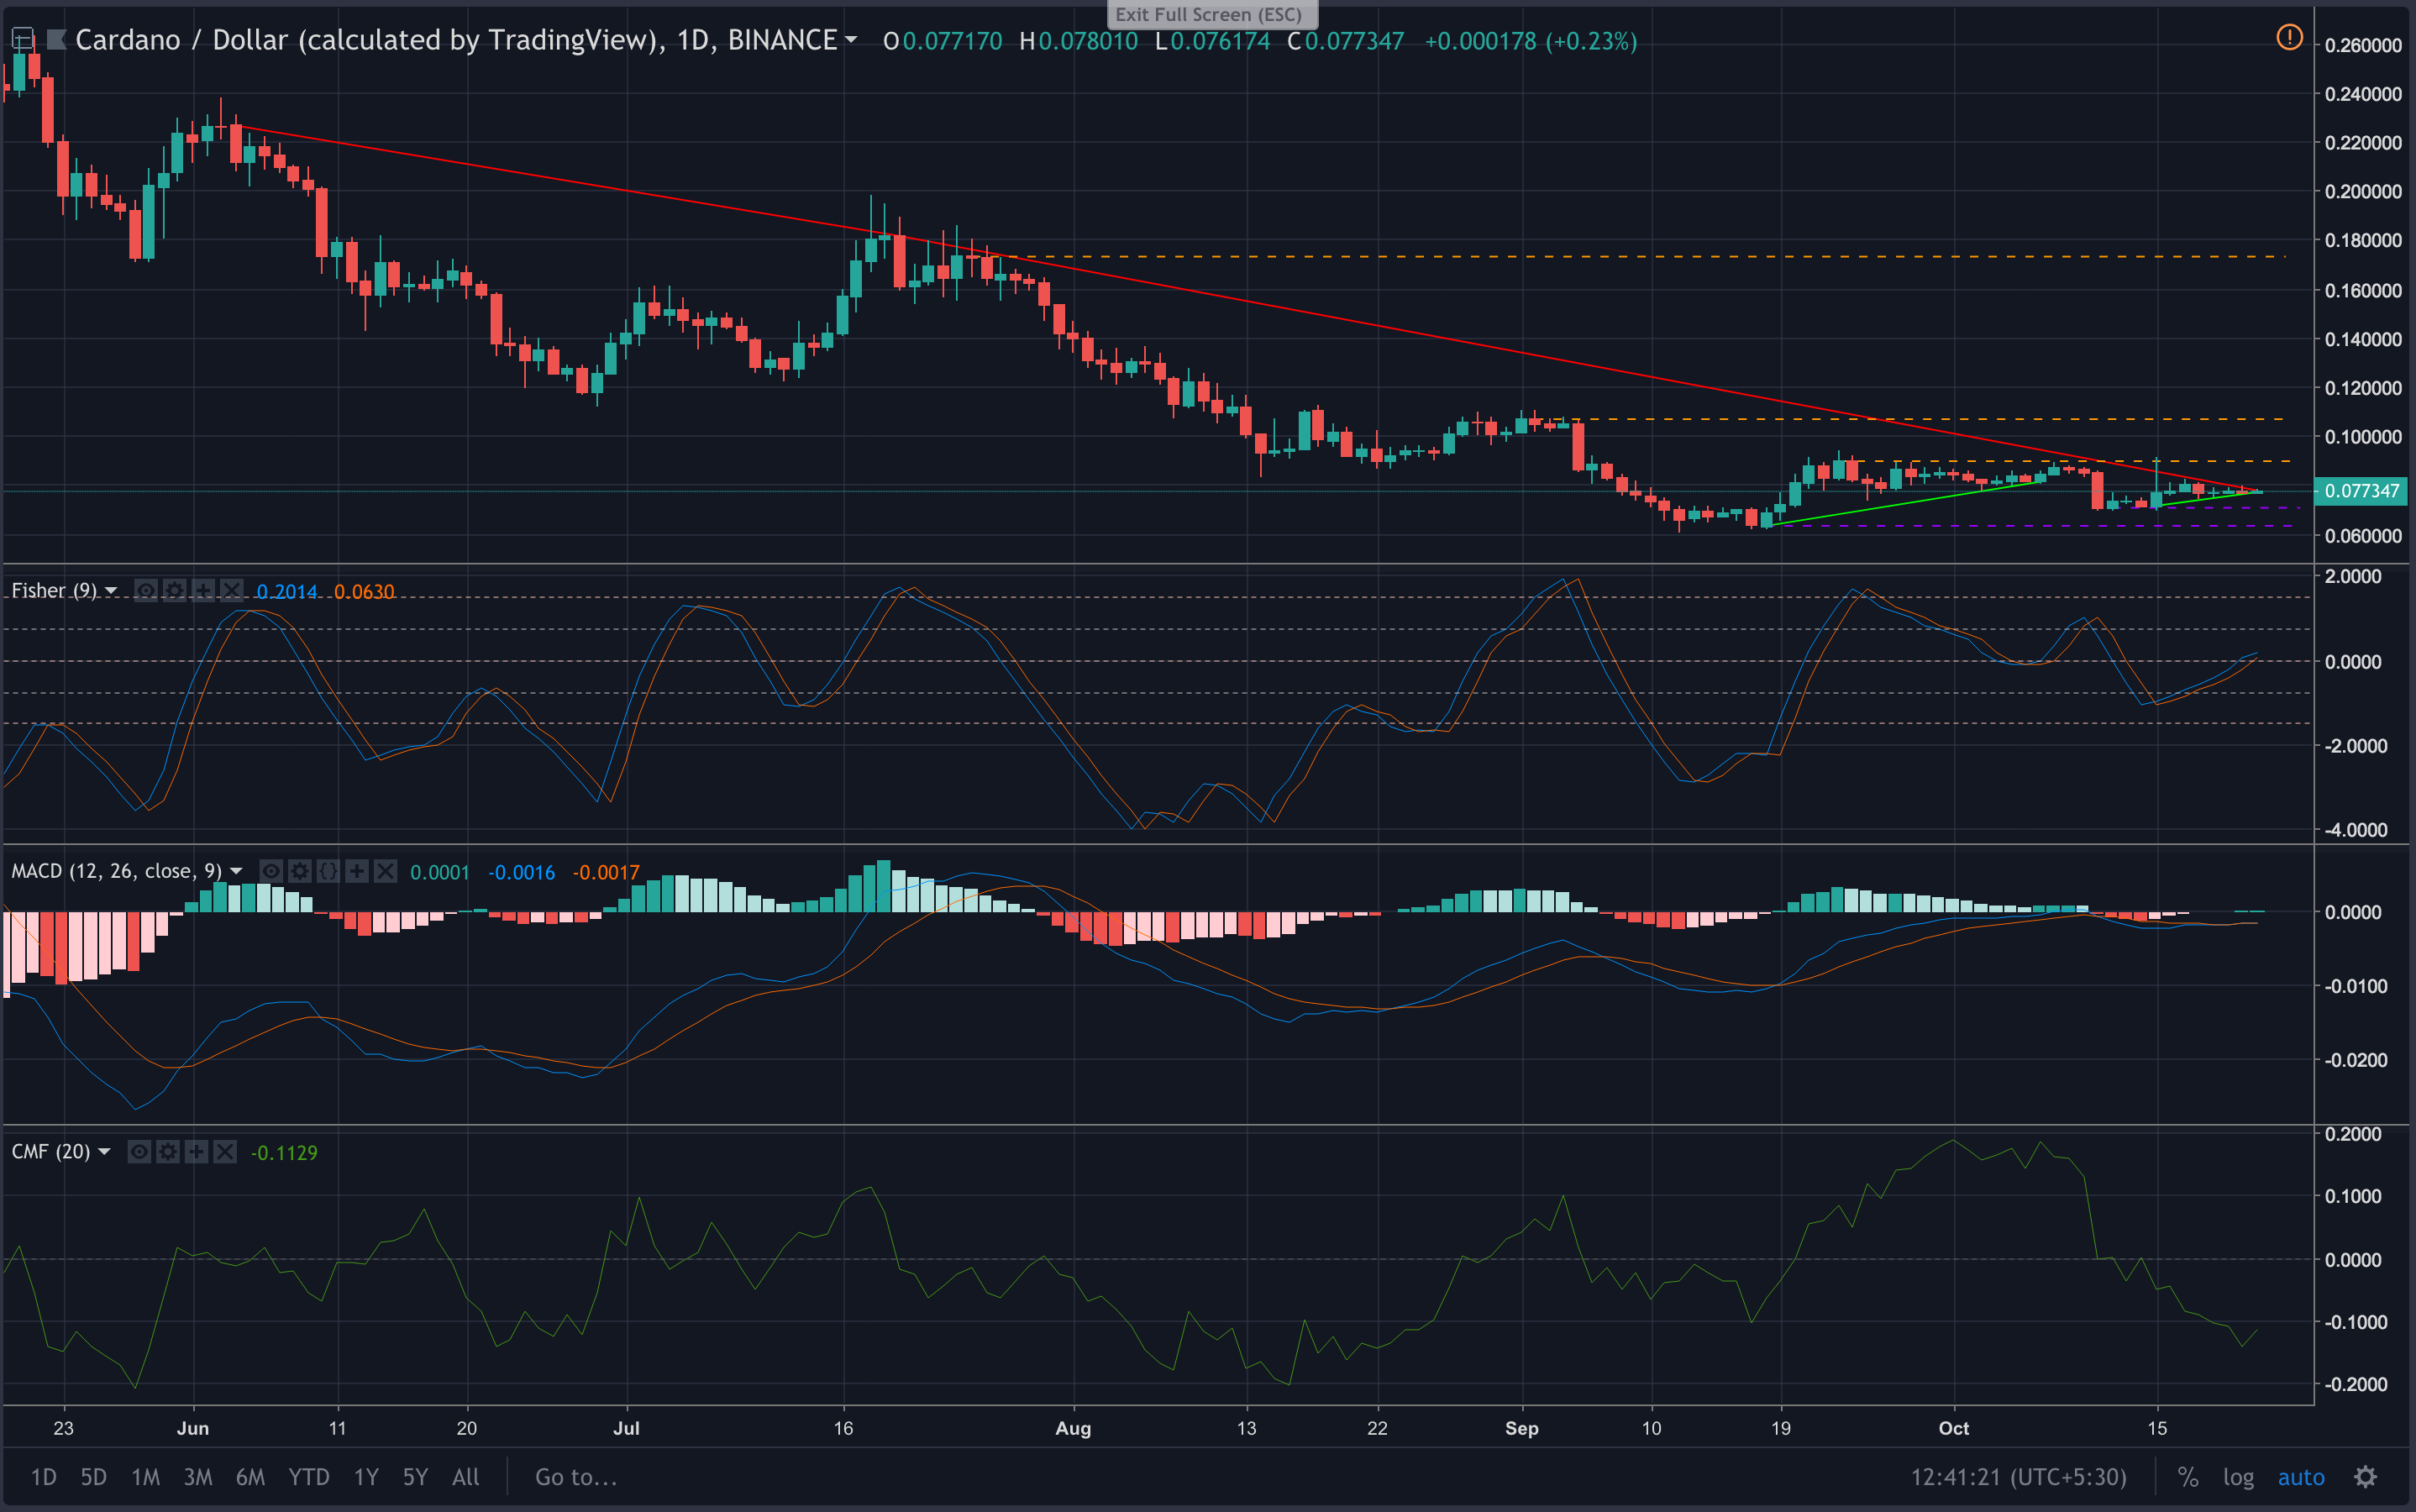
According to the one-day graph, the strong downtrend in the long-term seems to be robust between June 4 to October 22, 2018, from $0.226 to $0.181, further to $0.078.
An upward trend is seen from September 18 to October 7, 2018, from $0.063 to $0.081, and between October 15 to October 22, 2018, from $0.071 to $0.077.
The Fisher Transform chart shows the Fisher line moving uphill, crossing the trigger line. This indicates a bullish trend.
The MACD chart shows the moving average line on a downward drift, crossing the trigger line. This indicates a bearish market.
The Chaikin Money Flow chart shows the current value at -0.118. This indicates that money is flowing out of the market. This is a clear indicator of a bearish market.
However, an upwards drift seems to be emerging, pointing at a temporary bullish trend.
Conclusion:
In the short-term, if the prices are to move up as indicated by Parabolic SAR and Awesome Oscillator, the immediate resistance will be $0.078. If it is broken, the next resistance will be at $0.0806.
If the prices move down as predicted by RSI, the supports will be at $0.0767 and $0.0759.
In the long-term, if the prices are to go down as predicted by MACD and Chaikin Money Flow, the supports will be at $0.070 and $0.063.


Article comments