Bitcoin Cash SV [BSV] Technical Analysis: Cryptocurrency is all set for a slow and steady performance
![Bitcoin Cash SV [BSV] Technical Analysis: Cryptocurrency is all set for a slow and steady performance](https://coinhub.news/img/9b/9bdcdc42d57bac5d4efe296738466802_730_522.webp)
The recent hardfork of Bitcoin Cash [BCH] was one of the major news that caught the attention of many cryptocurrency investors lately. Both Bitcoin CashABC and Bitcoin Cash SV have managed to stay firm in the top 10 list in the past two weeks. Though Bitcoin Cash ABC struggled to keep up with a strong price range, it managed to stay at the 5th position based on the market capitalization.
However, Bitcoin Cash SV has shown a tremendous performance in the past week even during the bearish market trends. At the time of writing, BSV is trading at $95.62 with a market cap of $1.67 billion. The cryptocurrency has shown a massive 83.6% gain in the past 7 days. However, the 24 hours statistics show a negligible hike of 1.56%. The largest trading volume of 28.5% is seen to be on Upbit, followed by Binance, Bithumb and many more.
1 hour:
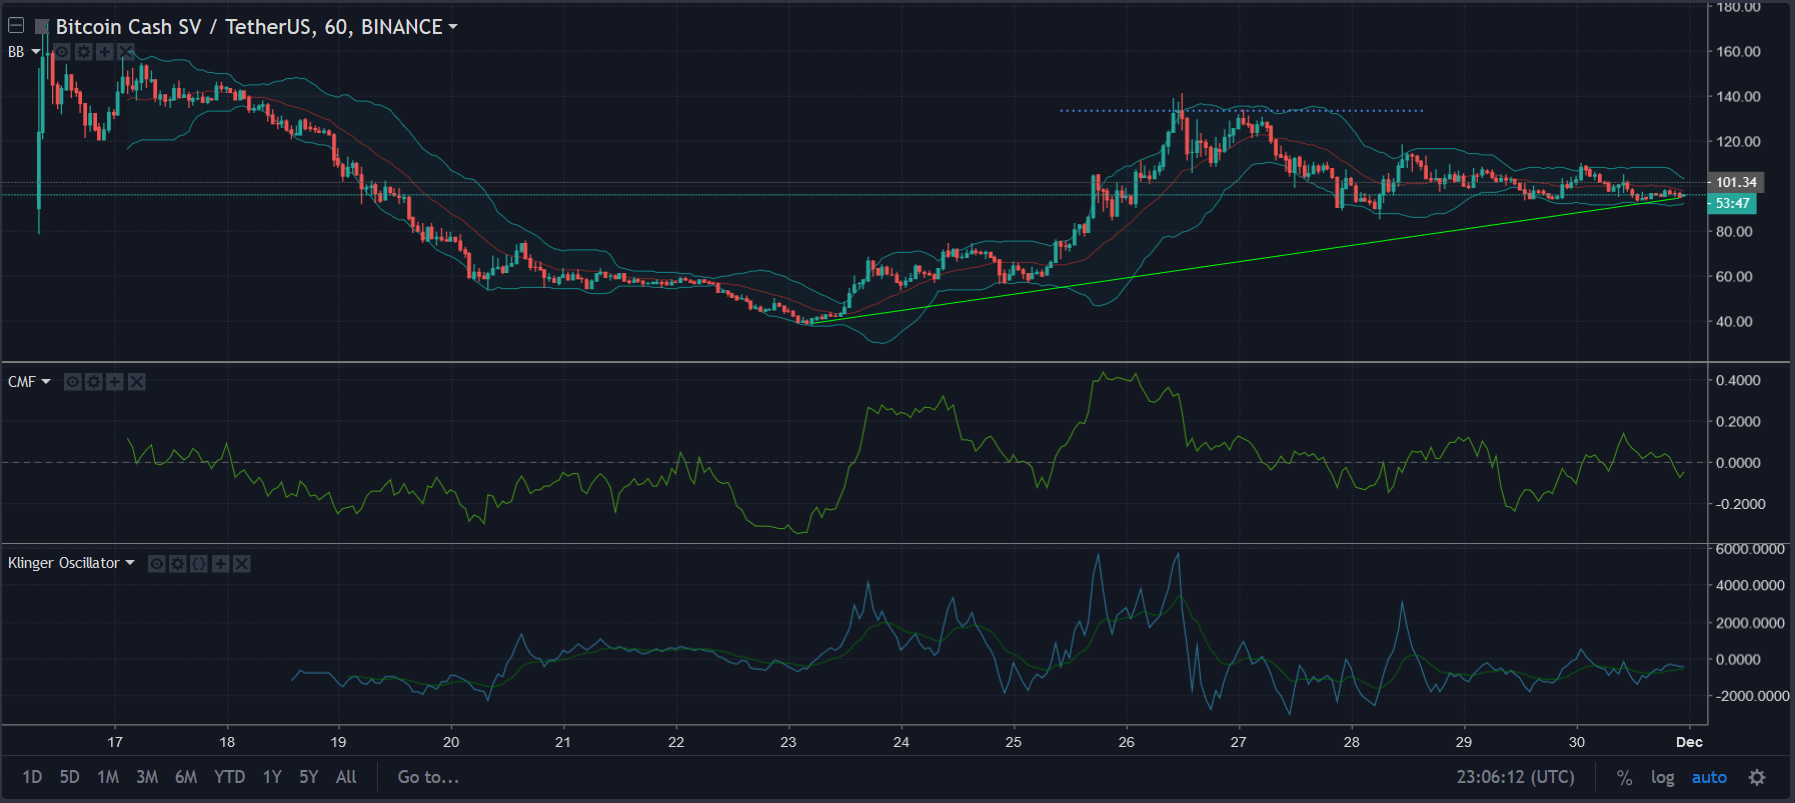
In the 1 hour chart Bitcoin Cash SV, there is an uptrend extending from 38.6 USDT – 94.2 USDT with a resistance point set at 132.06 USDT.
The Bollinger Bands are currently forming a narrow path depicting that the volatility in the market is very less.
Chaikin Money Flow [CMF] is moving below the zero line indicating that the inflow of money is reducing in the BSV market.
In case of Klinger Oscillator, both the signal line and reading line are moving together with no buy or sell signal in this timeframe.
4 hours:
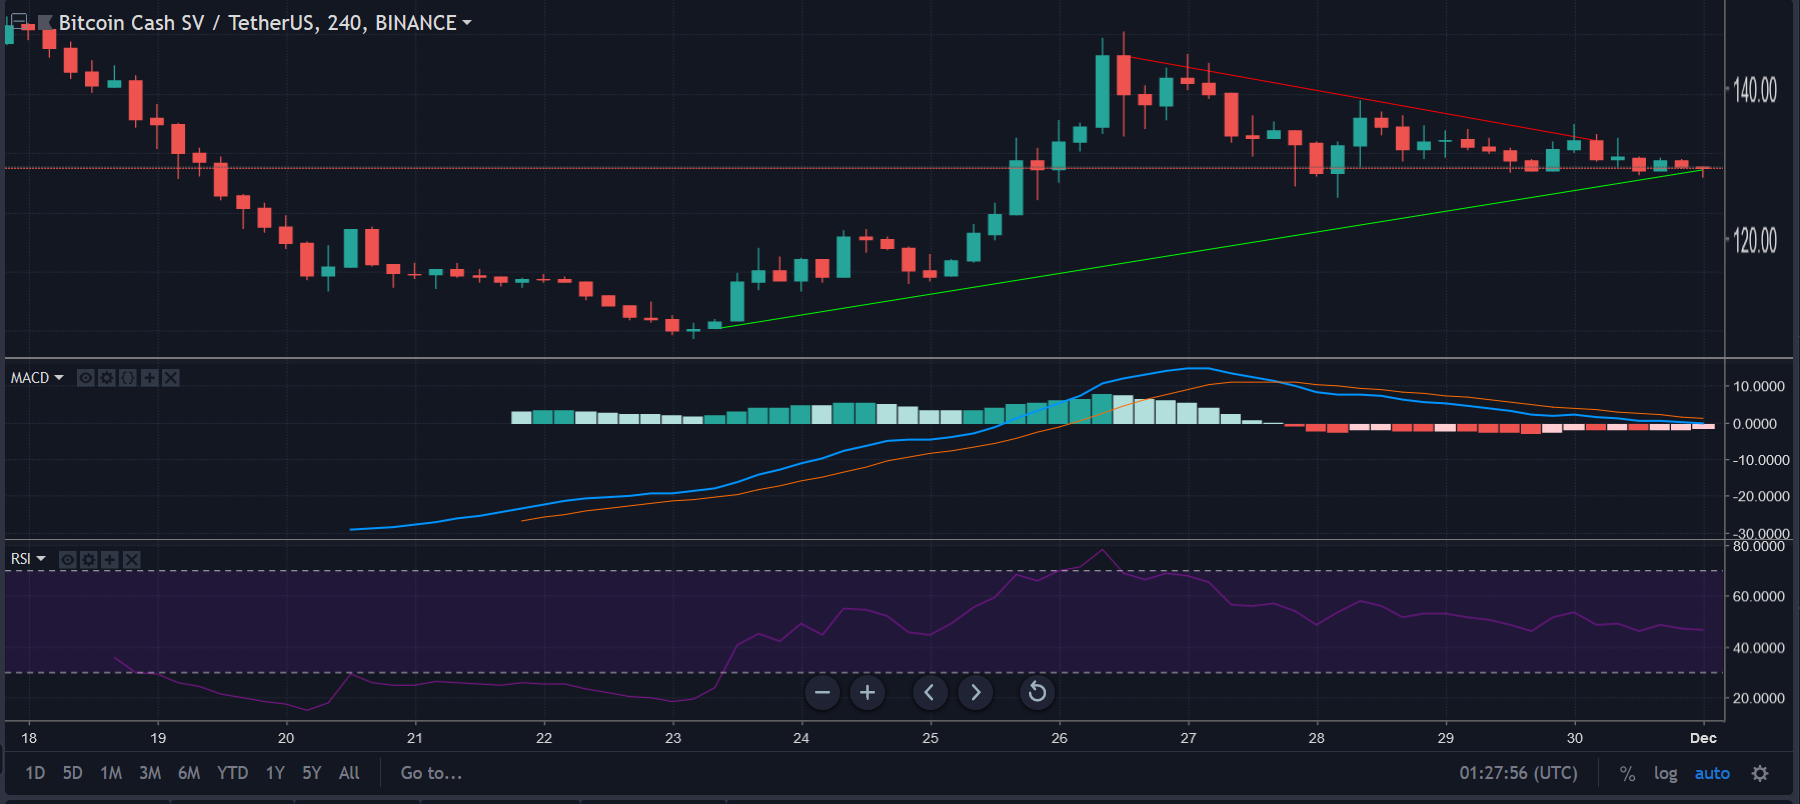
The 4-hour chart of Bitcoin Cash SV shows an uptrend ranging from 70 USDT – 94.29 USDT and the downtrend is extending from 133.6 USDT – 104 USDT.
The MACD has taken a bearish crossover currently with a negative histogram formation.
The Relative Strength Index [RSI] looks stable at the moment with the index line completely set within the RSI zone.
Conclusion:
According to the above Technical Analysis, Bitcoin Cash SV has high chances of having a less volatile market. As the Bollinger bands are forming a narrow path, we can expect a trend breakout as well.


Article comments